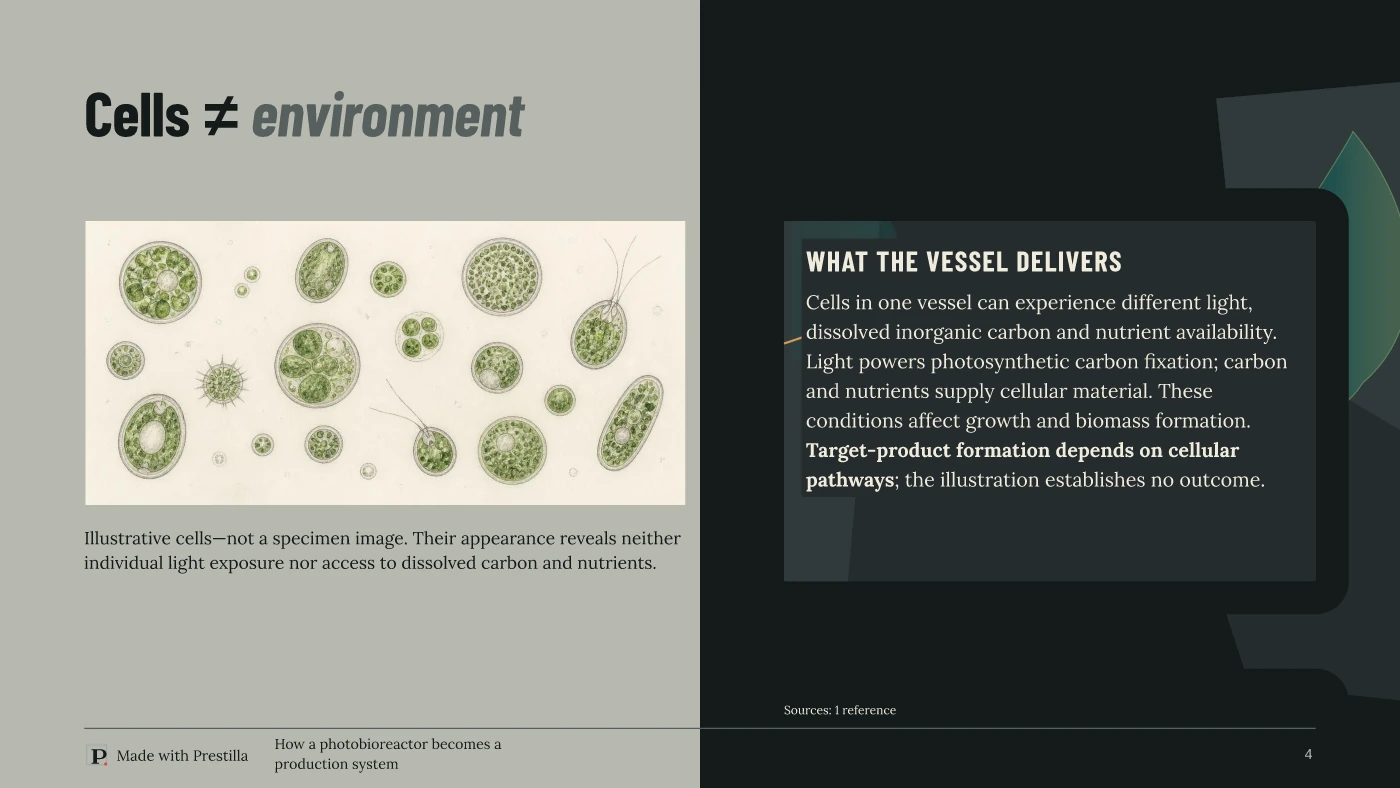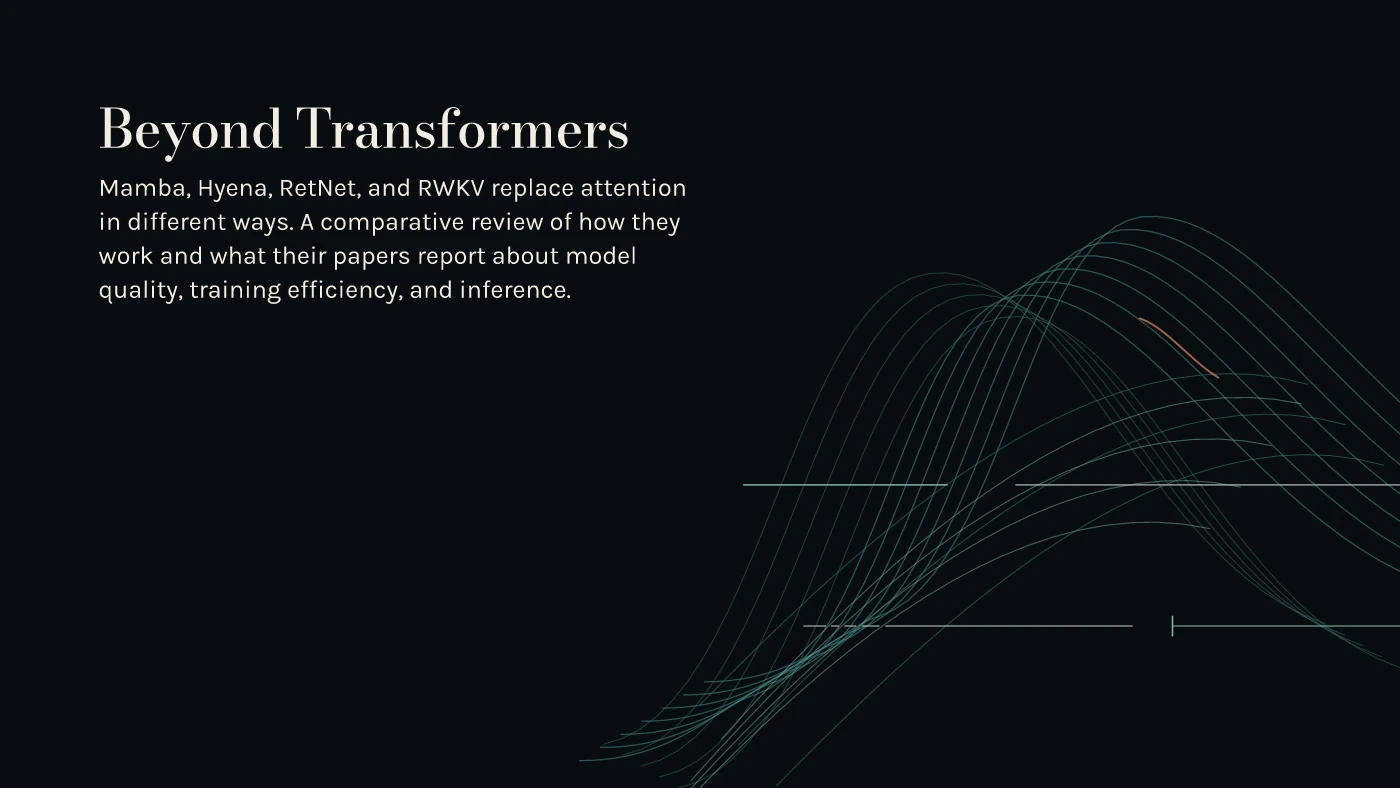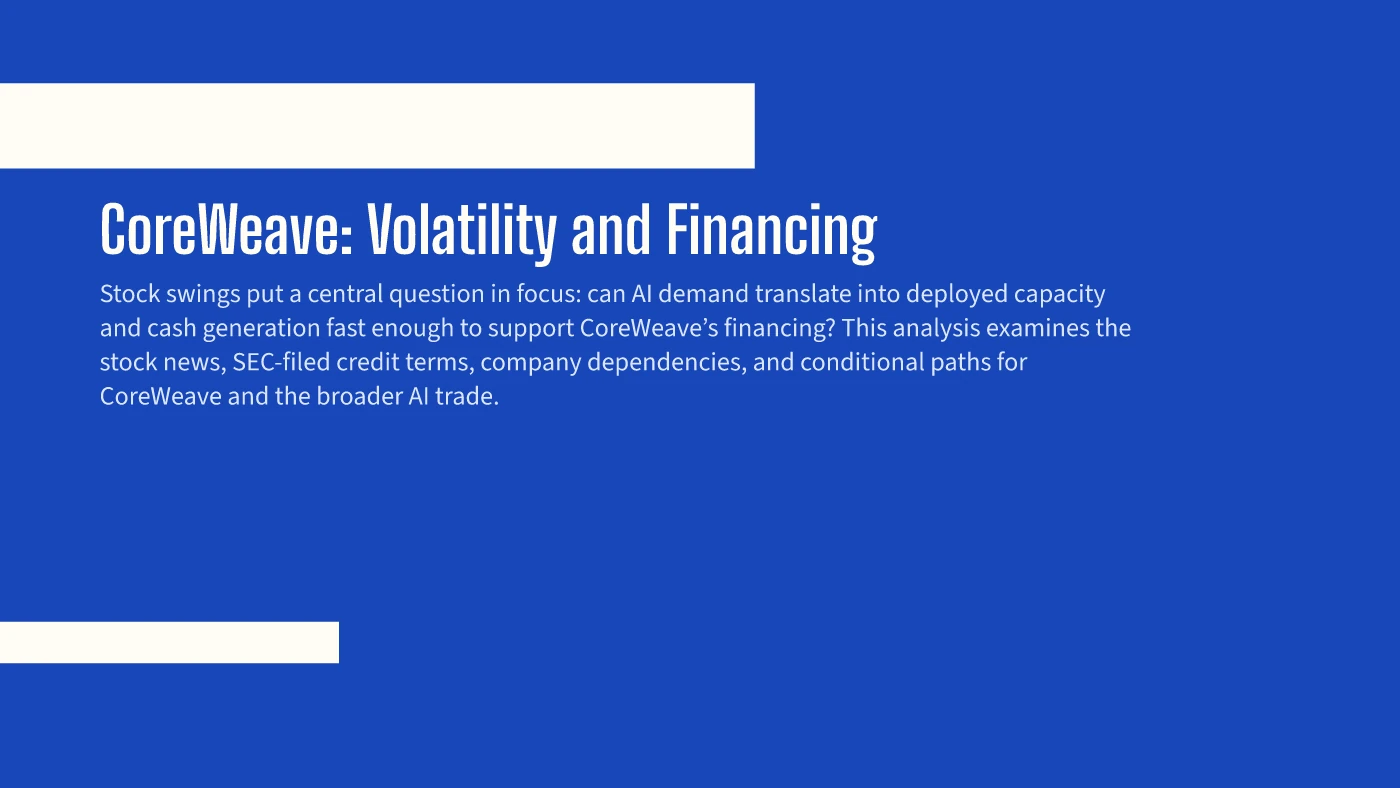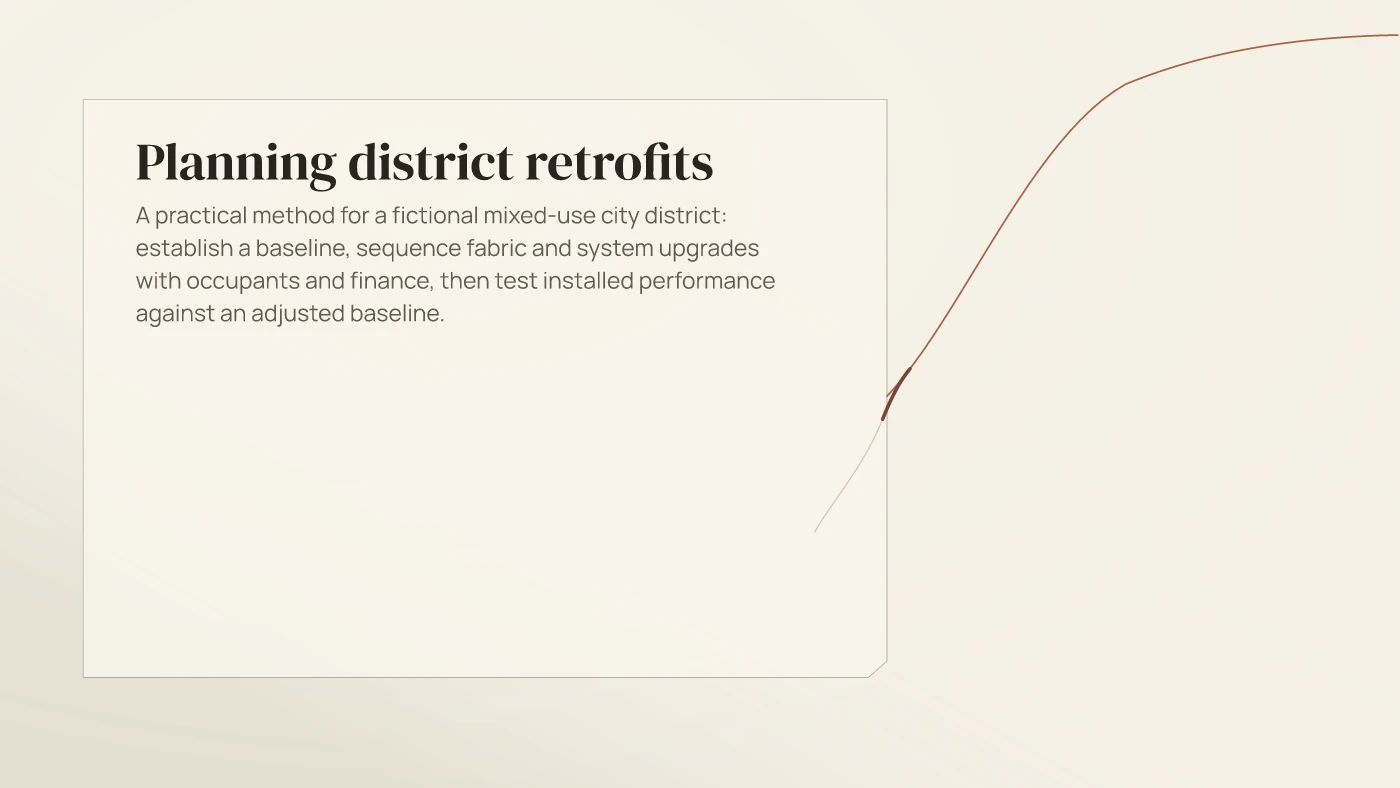
restilla

Your thinking. Your design. Your presentation.

AI slides with depth.Design them your way.

From your brief to a distinctive, editable presentation—with a generated design system, substantive research, and visuals built around your ideas.

Start with 100 free credits. No credit card required.
Pay as you go. No subscription.

Your designs and presentations stay in your account. No monthly subscription required.

01Create your design

A complete design system. Distinctly yours.

Describe your company, audience, and the impression you want to make. Prestilla creates a reusable design system—from fonts and colours to chart labels and diagram strokes.

Design my presentation

We’ll create your visual style first, then build your presentation. Allow extra time for your custom design.

100 free credits · No credit card required

02Style every slide

One visual language. Across every slide.

Carry your design through the whole presentation, from the opening idea to the evidence and recommendations.

Solar Counterform: How solar and storage support a resilient microgrid. Actual Prestilla native render; illustrative microgrid example.
Cover
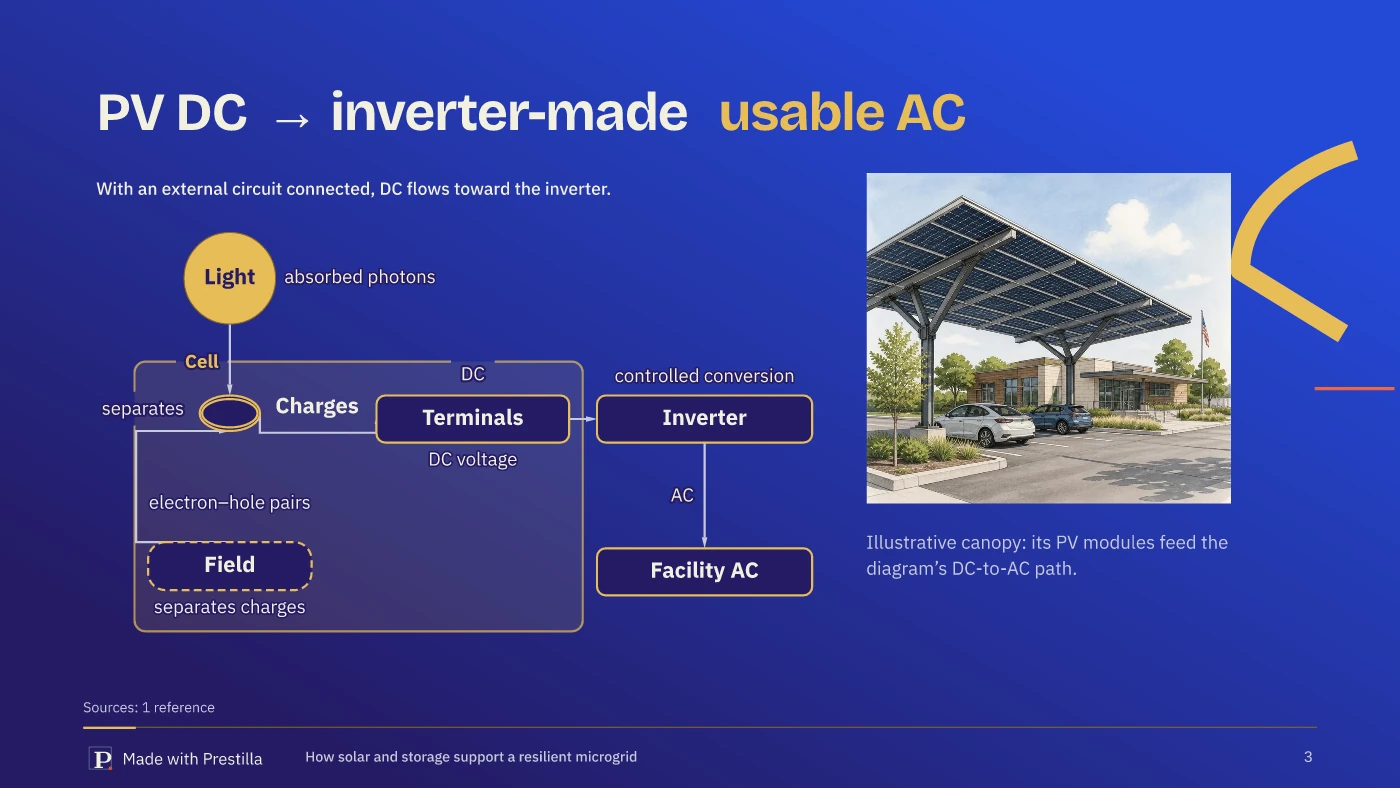
Solar Counterform: A PV cell makes DC; an inverter makes usable AC. Actual Prestilla native render; illustrative microgrid example.
Scientific diagram
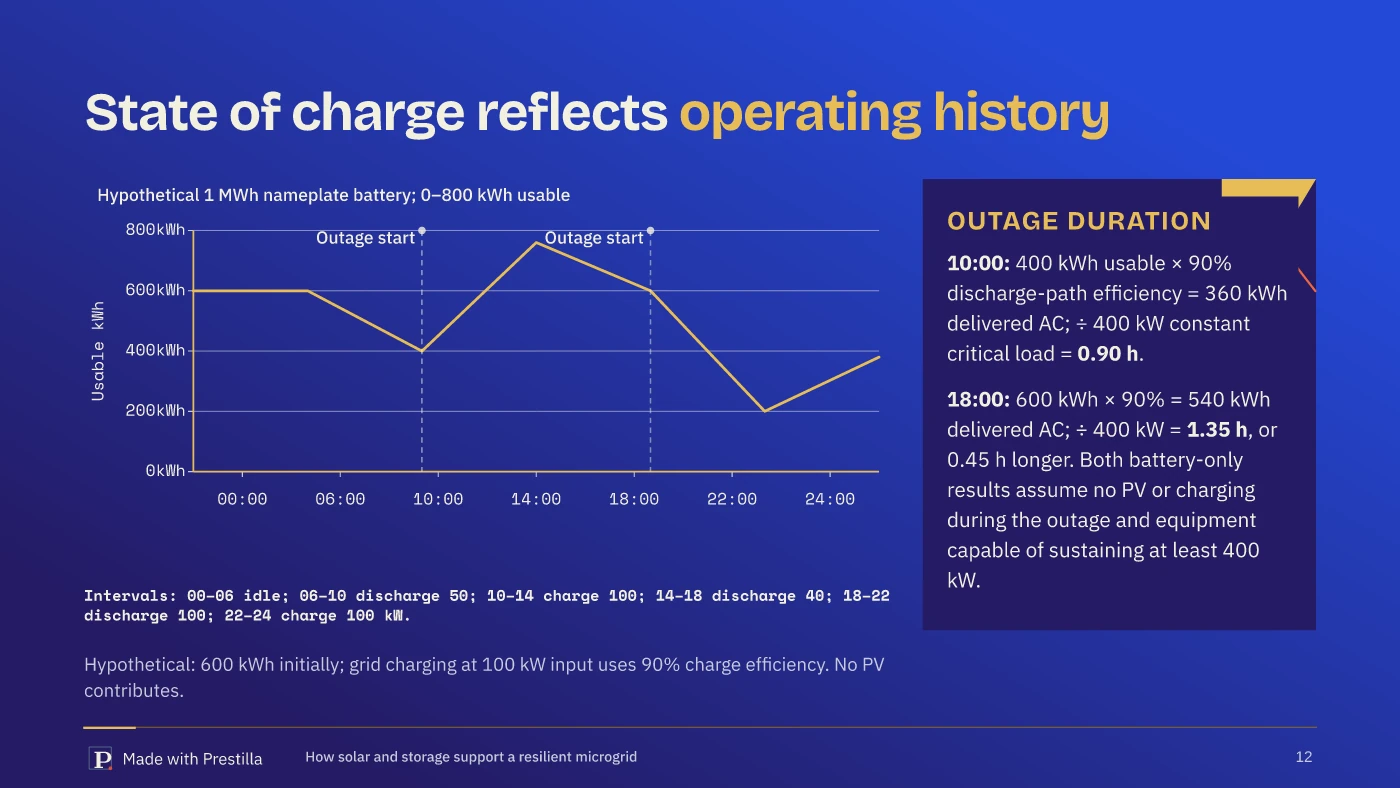
Solar Counterform: State of charge records the operating history. Actual Prestilla native render; illustrative microgrid example.
Line chart
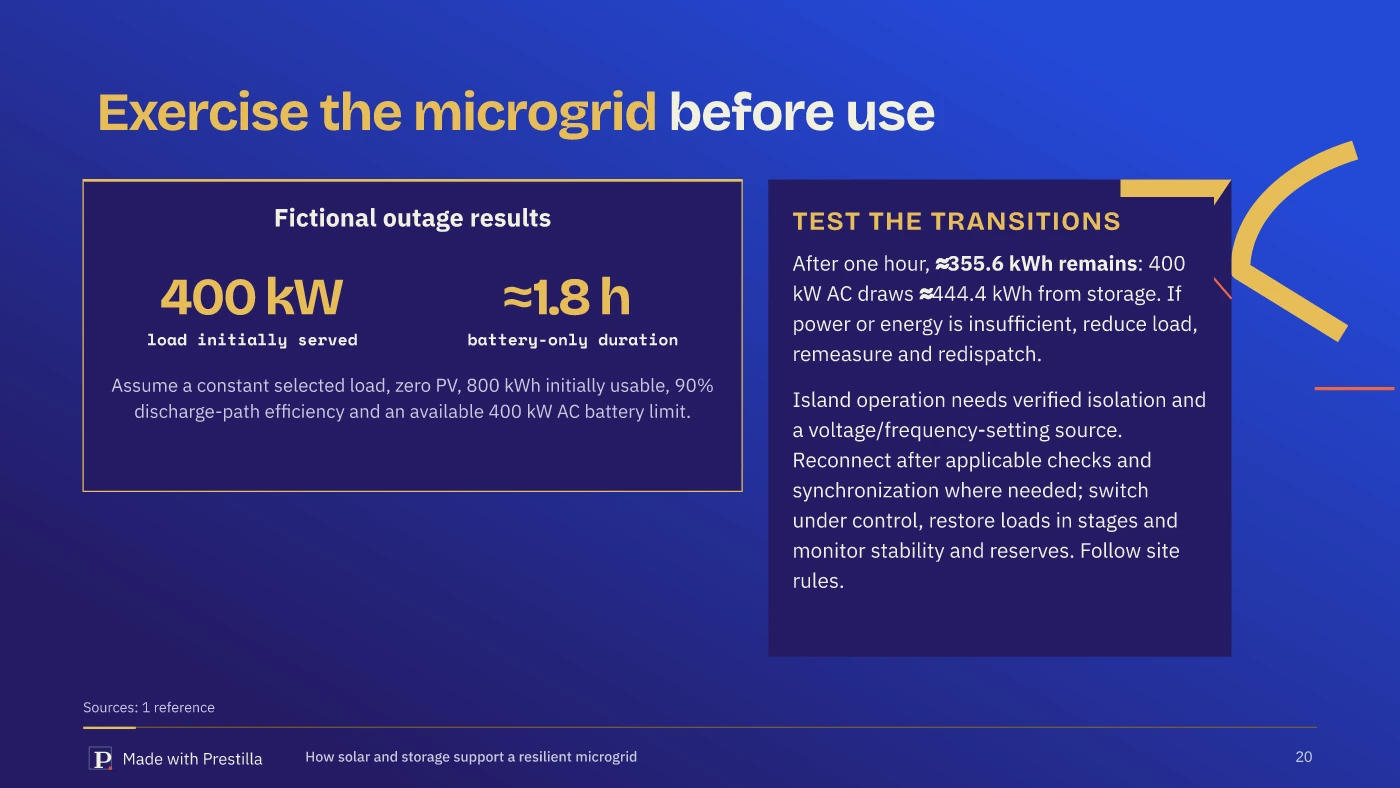
Solar Counterform: Exercise the microgrid before relying on it. Actual Prestilla native render; illustrative microgrid example.
Recommendations
Create my own design

We’ll create your visual style first, then build your presentation. Allow extra time for your custom design.

100 free credits · No credit card required

03Reuse your theme

Create your design once. Use it again and again.

Save your design in Prestilla and reuse it across future presentations. Keep your designs and presentations in your account with no monthly subscription. Pay for credits when you need more.

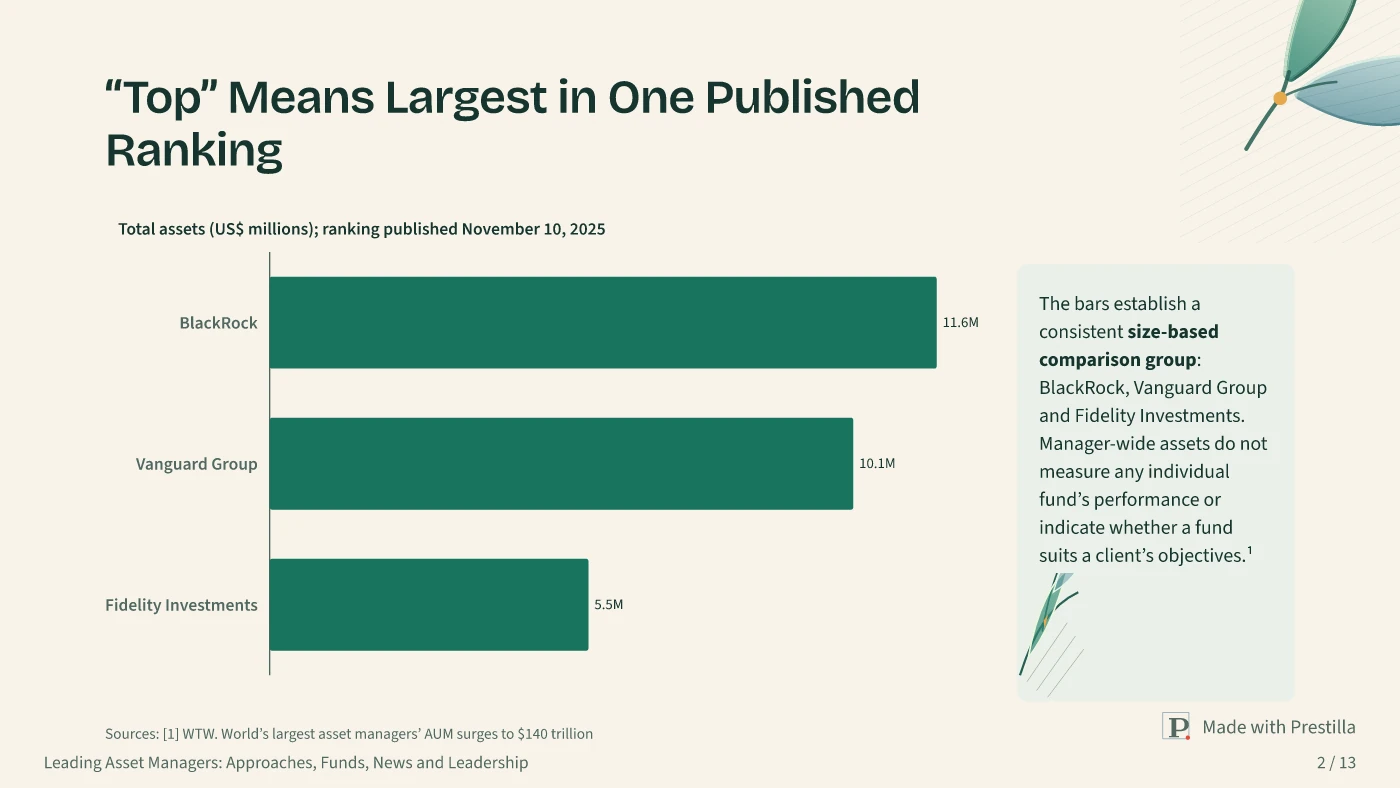
Asset management

Shared Light — Open Canopy: Leading Asset Managers: A Client Guide. Slide 1 from Leading Asset Managers: Approaches, Funds, News and Leadership. Actual Prestilla output.Shared Light — Open Canopy: “Top” Means Largest in One Published Ranking. Slide 2 from Leading Asset Managers: Approaches, Funds, News and Leadership. Actual Prestilla output.

U.S. agriculture

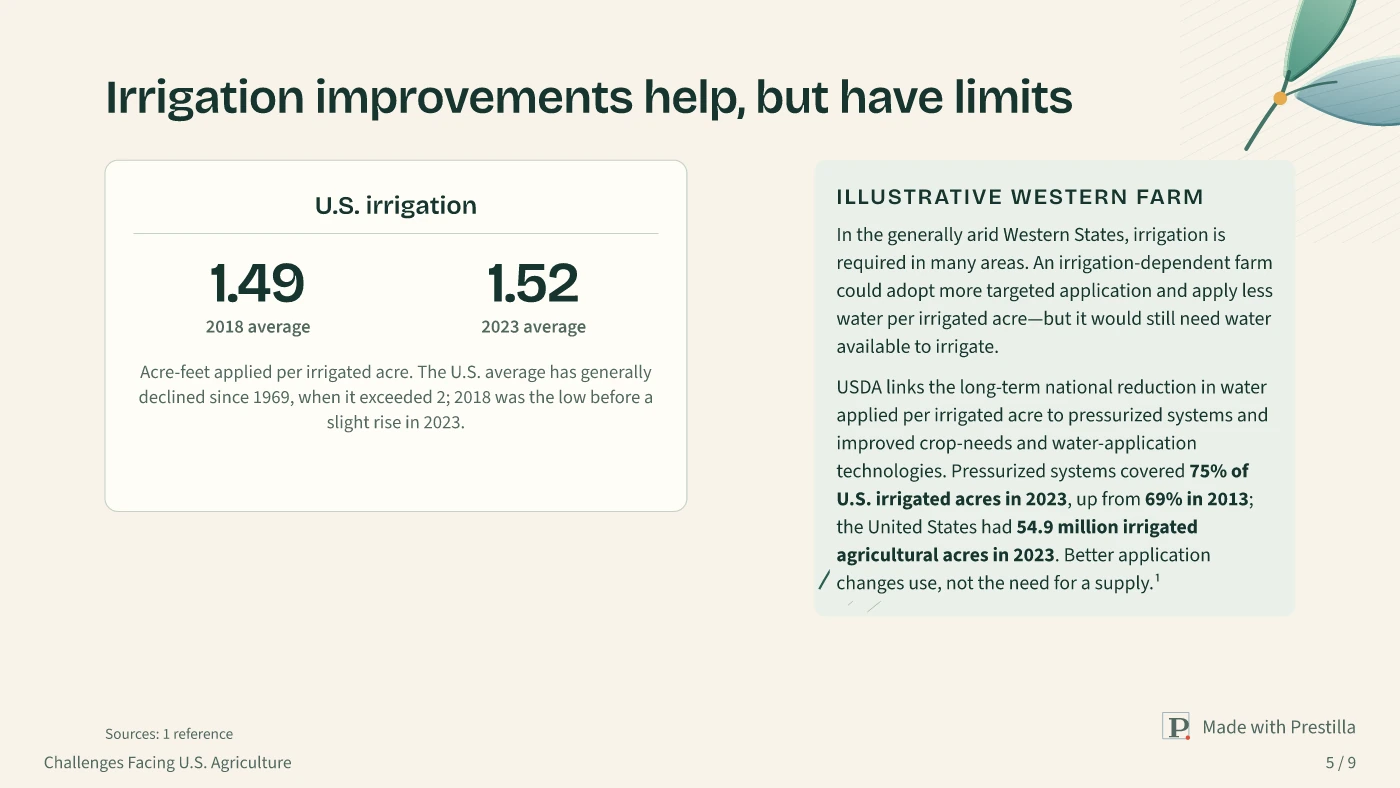
Shared Light — Open Canopy: Challenges Facing U.S. Agriculture. Slide 1 from Challenges Facing U.S. Agriculture. Actual Prestilla output.Shared Light — Open Canopy: Irrigation improvements help, but have limits. Slide 5 from Challenges Facing U.S. Agriculture. Actual Prestilla output.
Create with my own style

100 free credits · No credit card required

04Rich data stories

Real charts and diagrams. Styled to match your deck.

Charts and diagrams inherit your presentation’s fonts, colours, and styling. Chart data and diagram structure remain editable—not flattened into an image. Update the numbers, labels, or connections without rebuilding the visual.

Diagrams

20+ diagram types
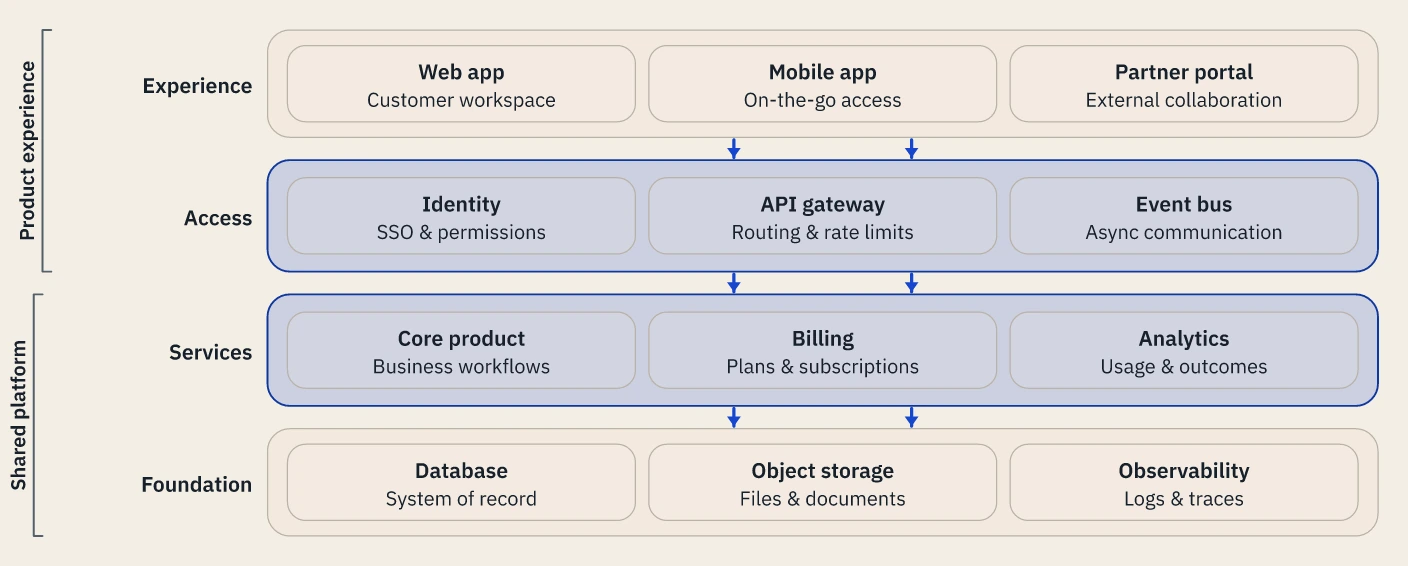
Layered platform architecture with experience, access, services and foundation tiers. Actual Prestilla output; illustrative content.
Architecture
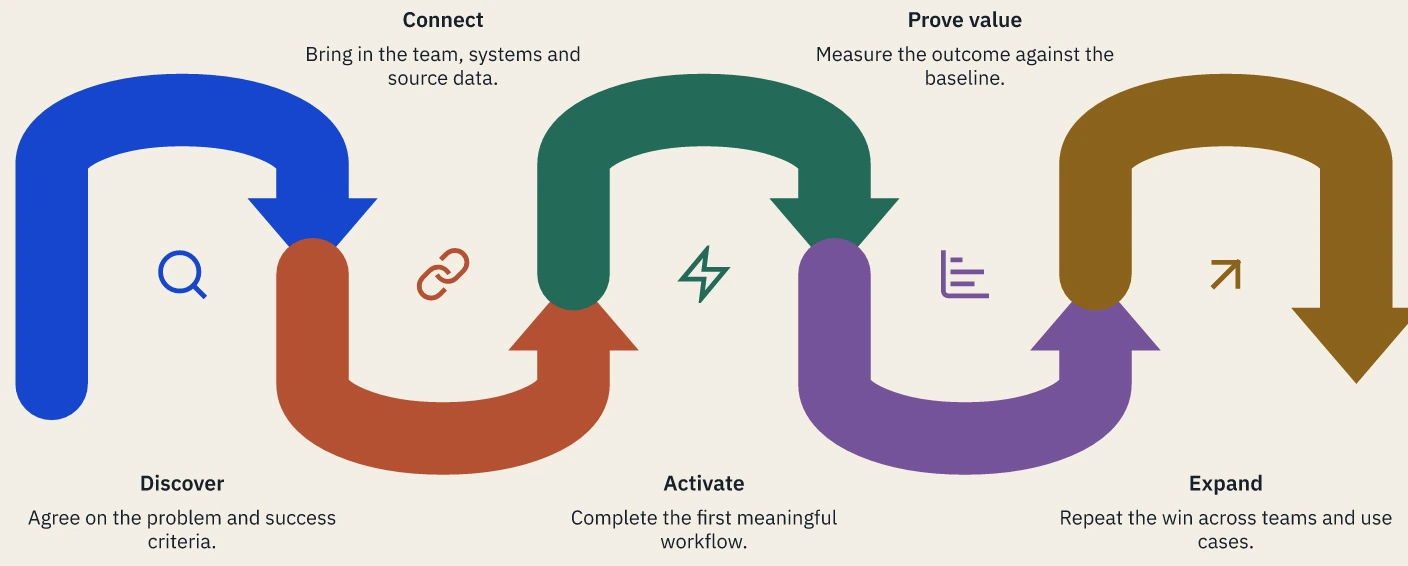
Five-step customer journey from discovery to expansion. Actual Prestilla output; illustrative content.
Onboarding
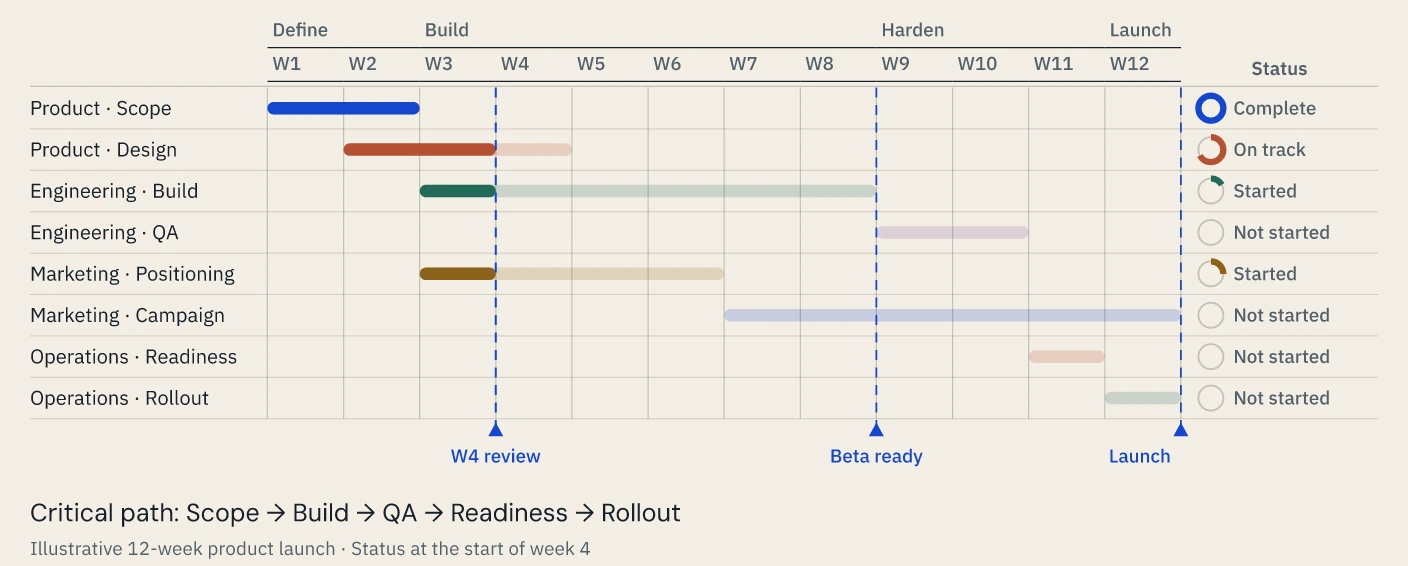
A 12-week launch plan with workstreams, progress, milestones and a critical path. Actual Prestilla output; illustrative content.
Project plan
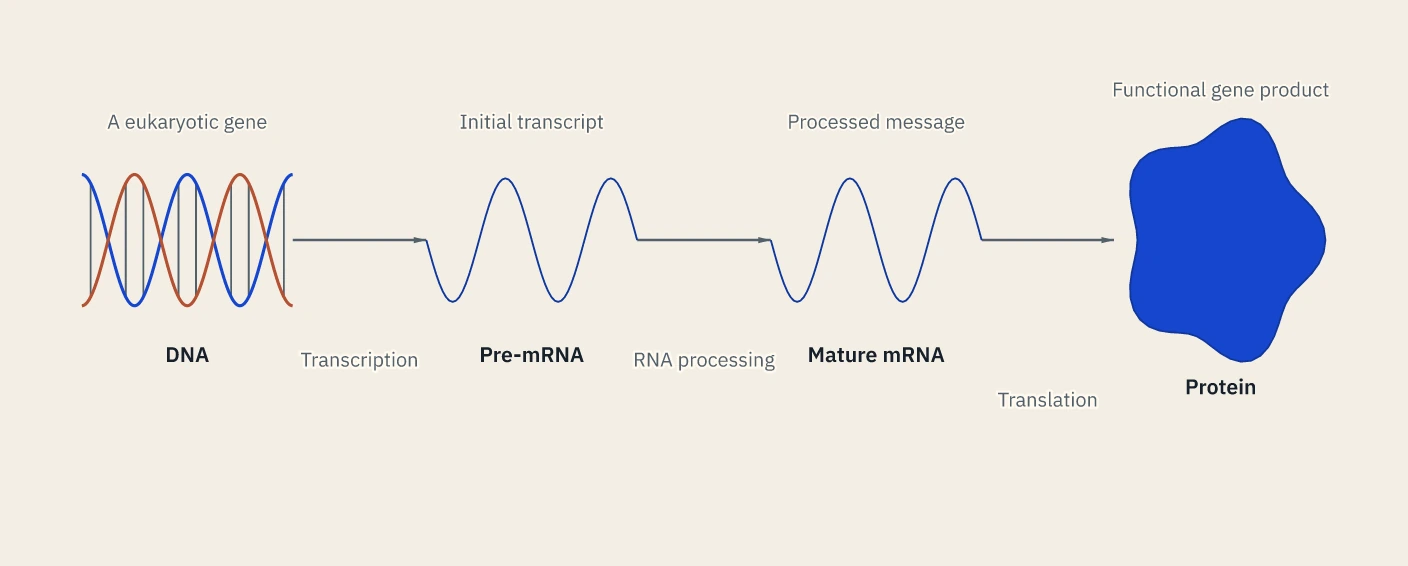
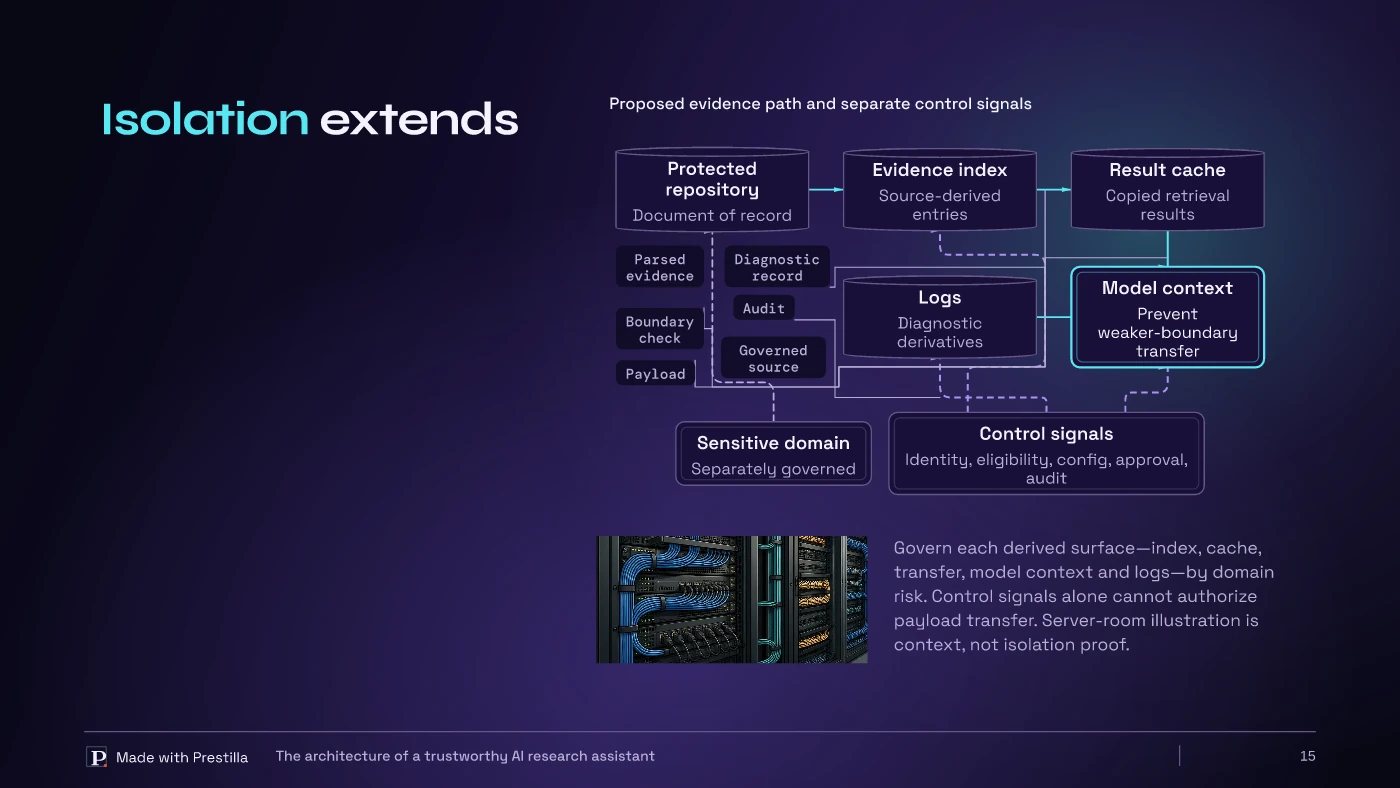
An illustrated molecular pathway from a eukaryotic gene through RNA processing to protein. Actual Prestilla output; illustrative content.
Scientific pathway

Charts

40+ chart types
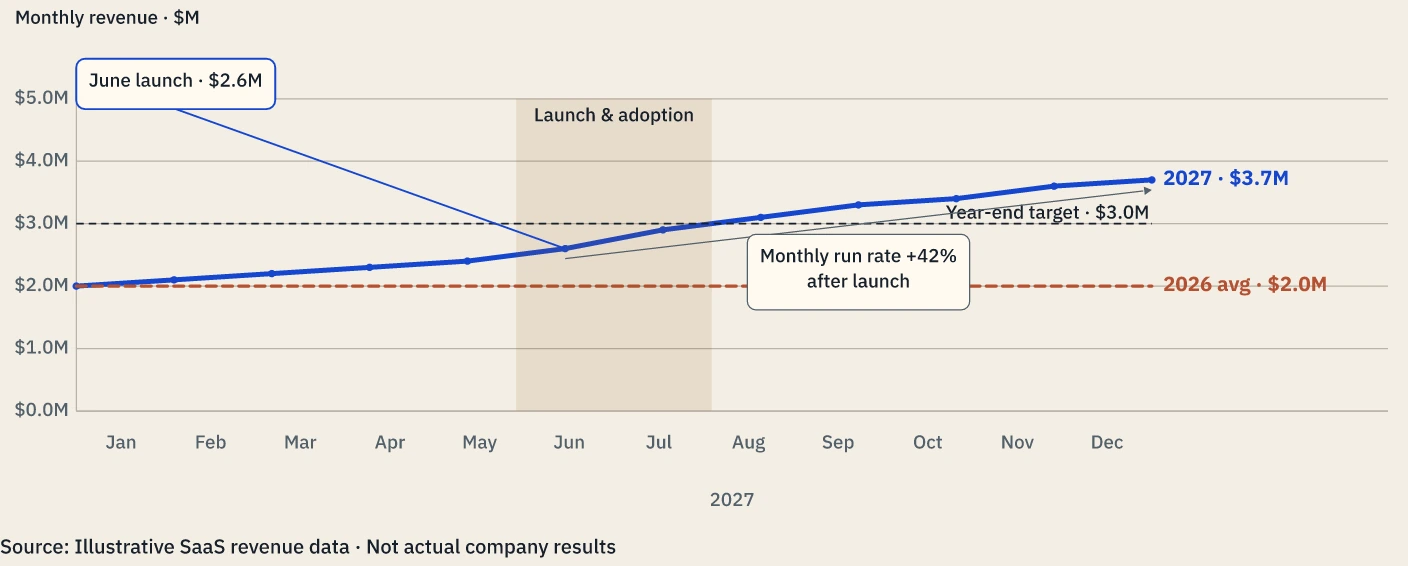
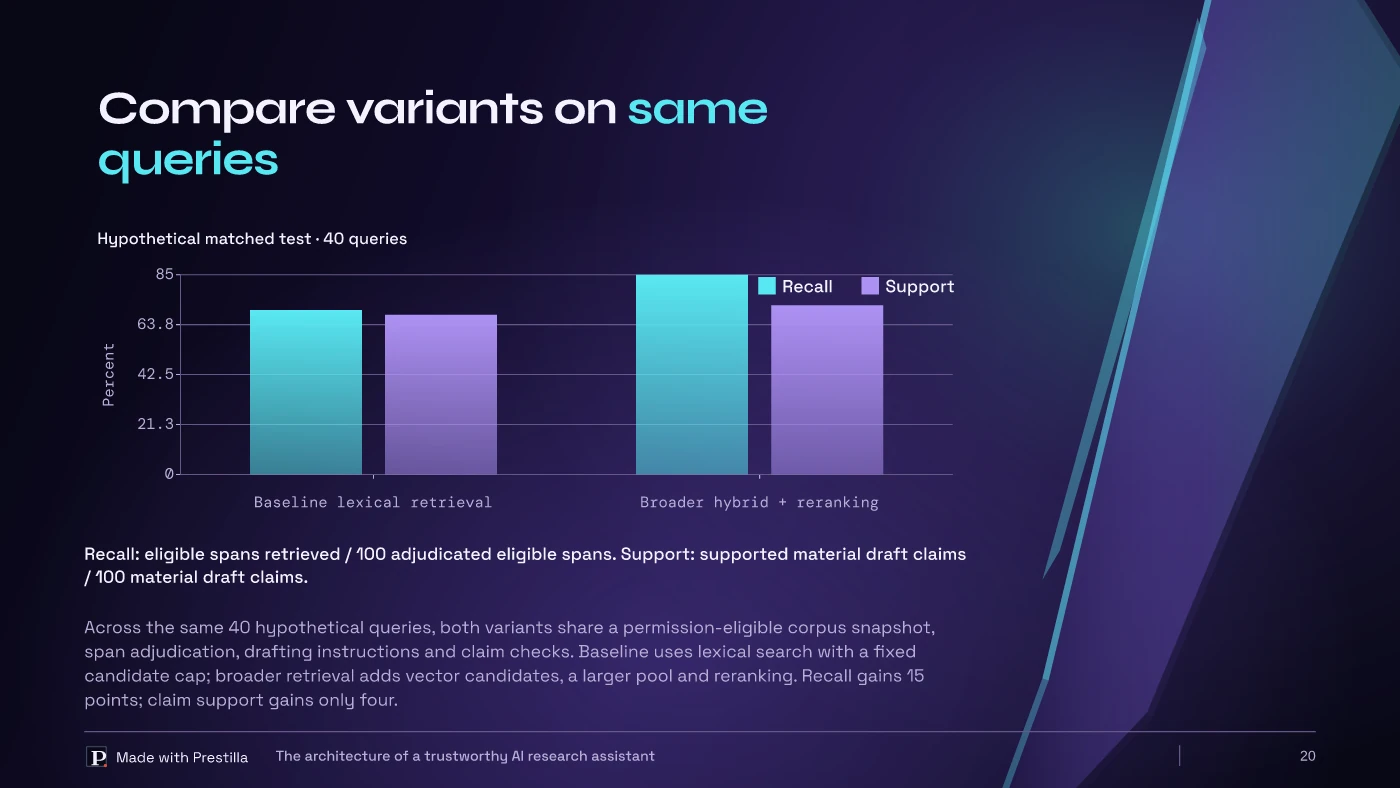
Monthly revenue with shaded launch period, target, direct labels and change arrow. Actual Prestilla output; illustrative content.
Annotated line
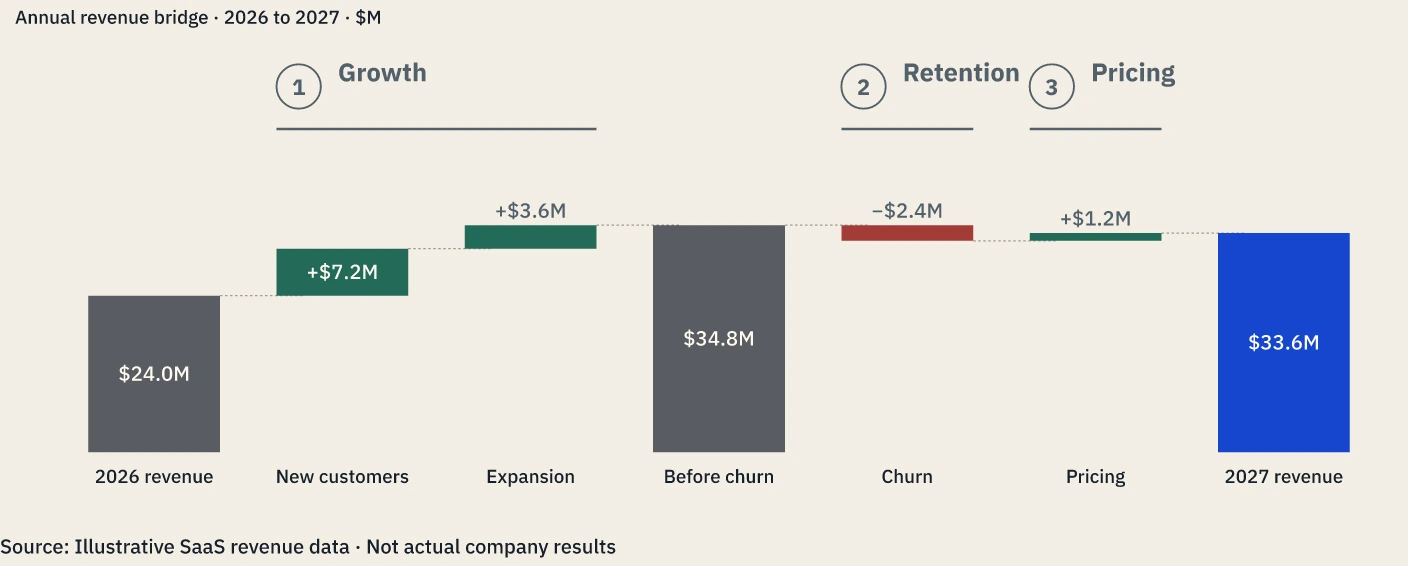
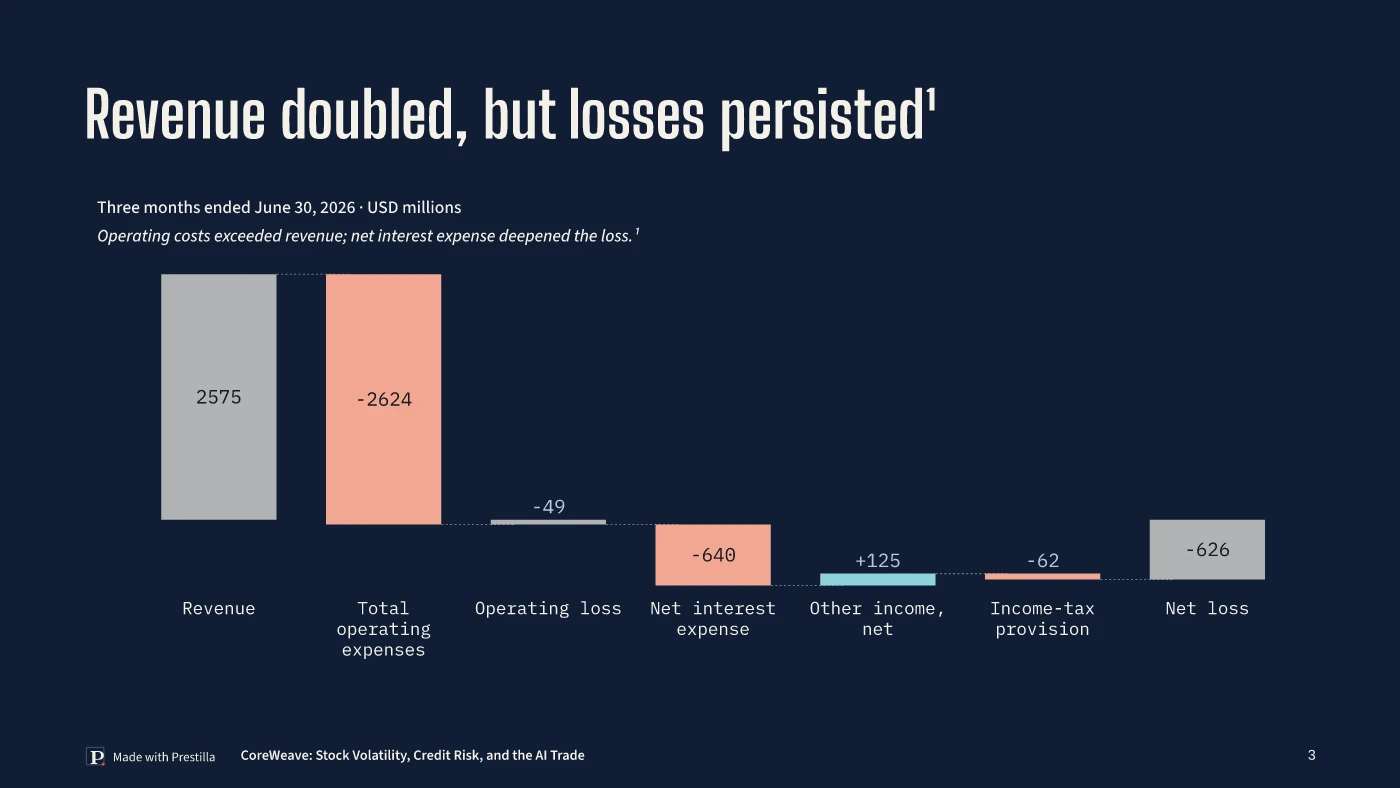
A revenue bridge with signed drivers, subtotal, numbered phases and running-total connectors. Actual Prestilla output; illustrative content.
Revenue waterfall
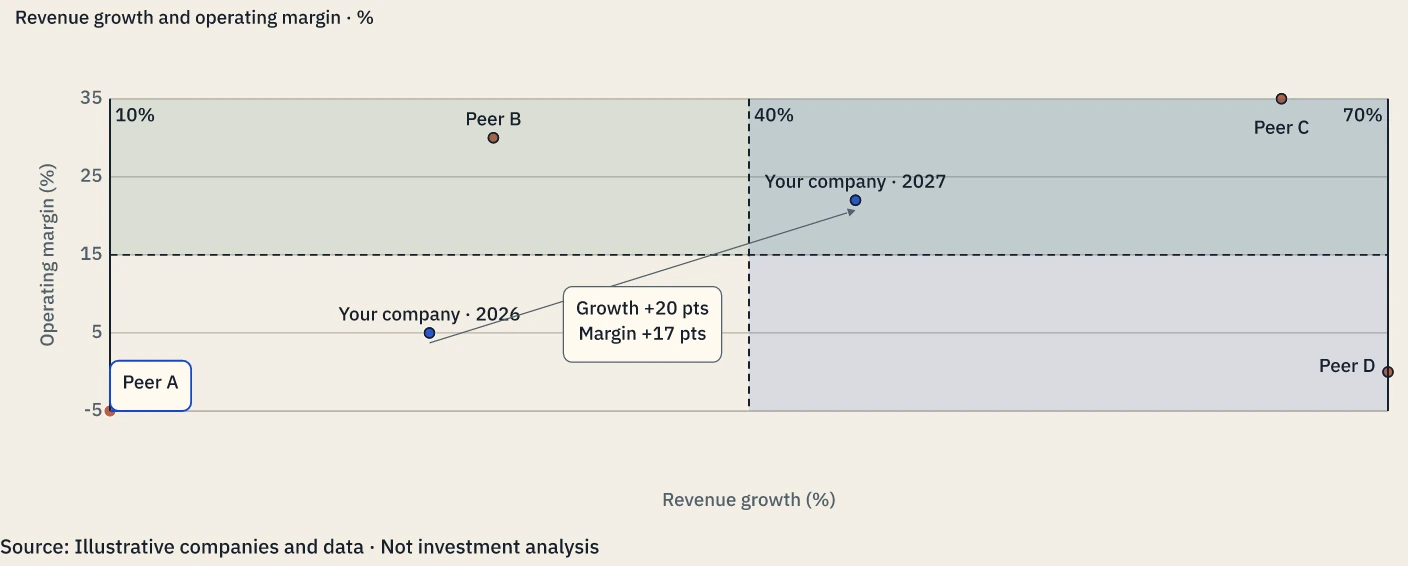
Competitive positioning with shaded quadrants, peer labels and a movement arrow. Actual Prestilla output; illustrative content.
Scatter plot
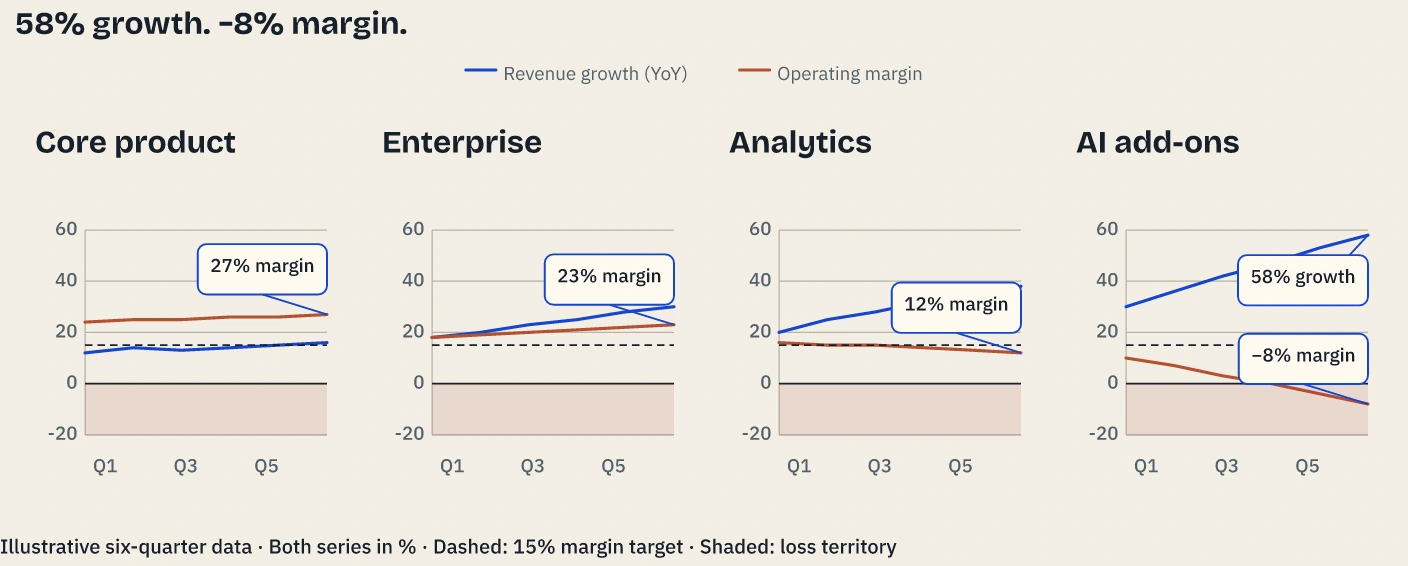
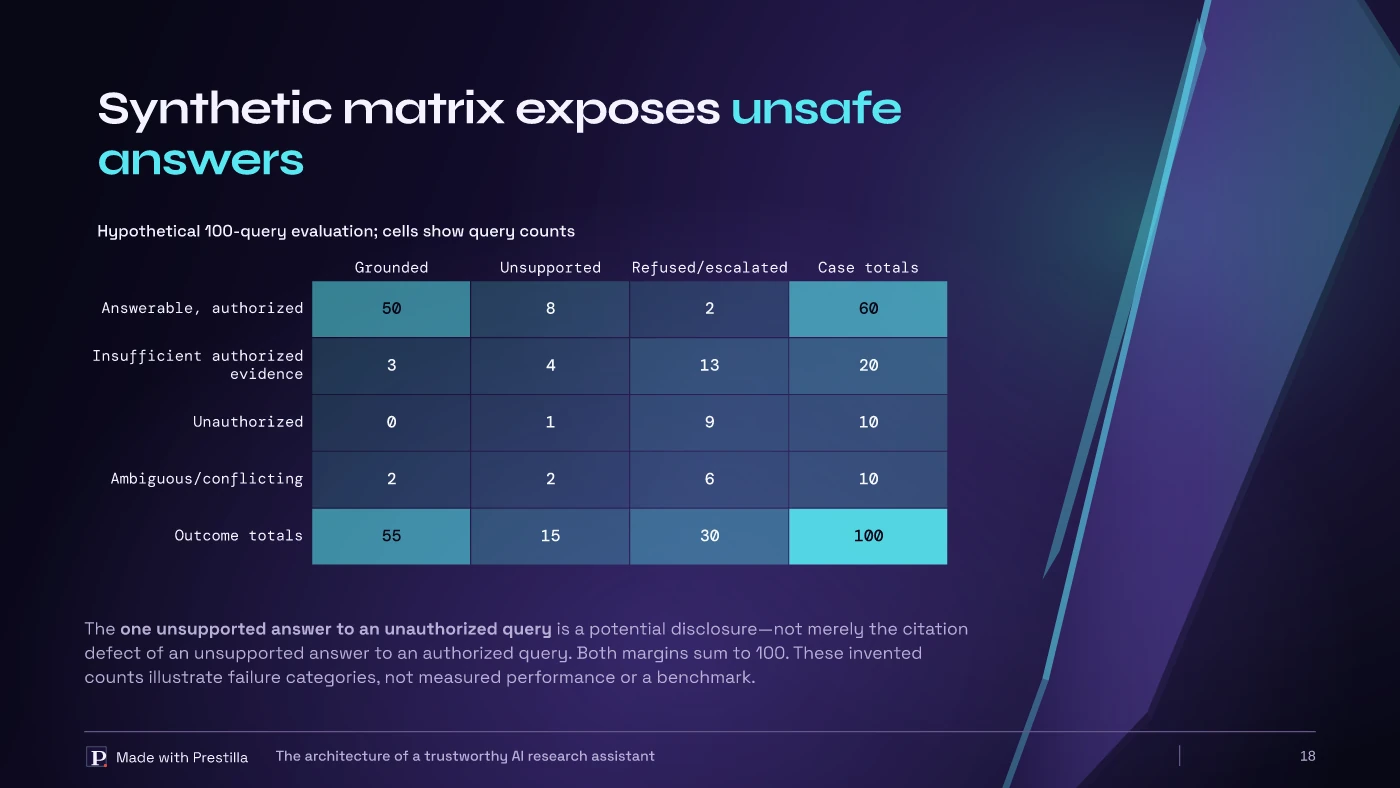
Four product segments compare year-over-year revenue growth and operating margin over six quarters on identical −20% to 60% scales. A 15% margin target, shaded loss territory and annotated endpoints reveal AI add-ons at 58% growth and −8% margin. Actual editable Prestilla output; synthetic illustrative data.
Growth vs margin

Editable data · Editable structure · Your theme throughout

Turn my ideas into slides

100 free credits · No credit card required

05Edit in plain English

Ask for the change. See the difference.

Edit directly or describe the change. Refine the text, data, layout, and visual details after the first draft.

“Highlight the margin decline and explain what drove it.”

Before
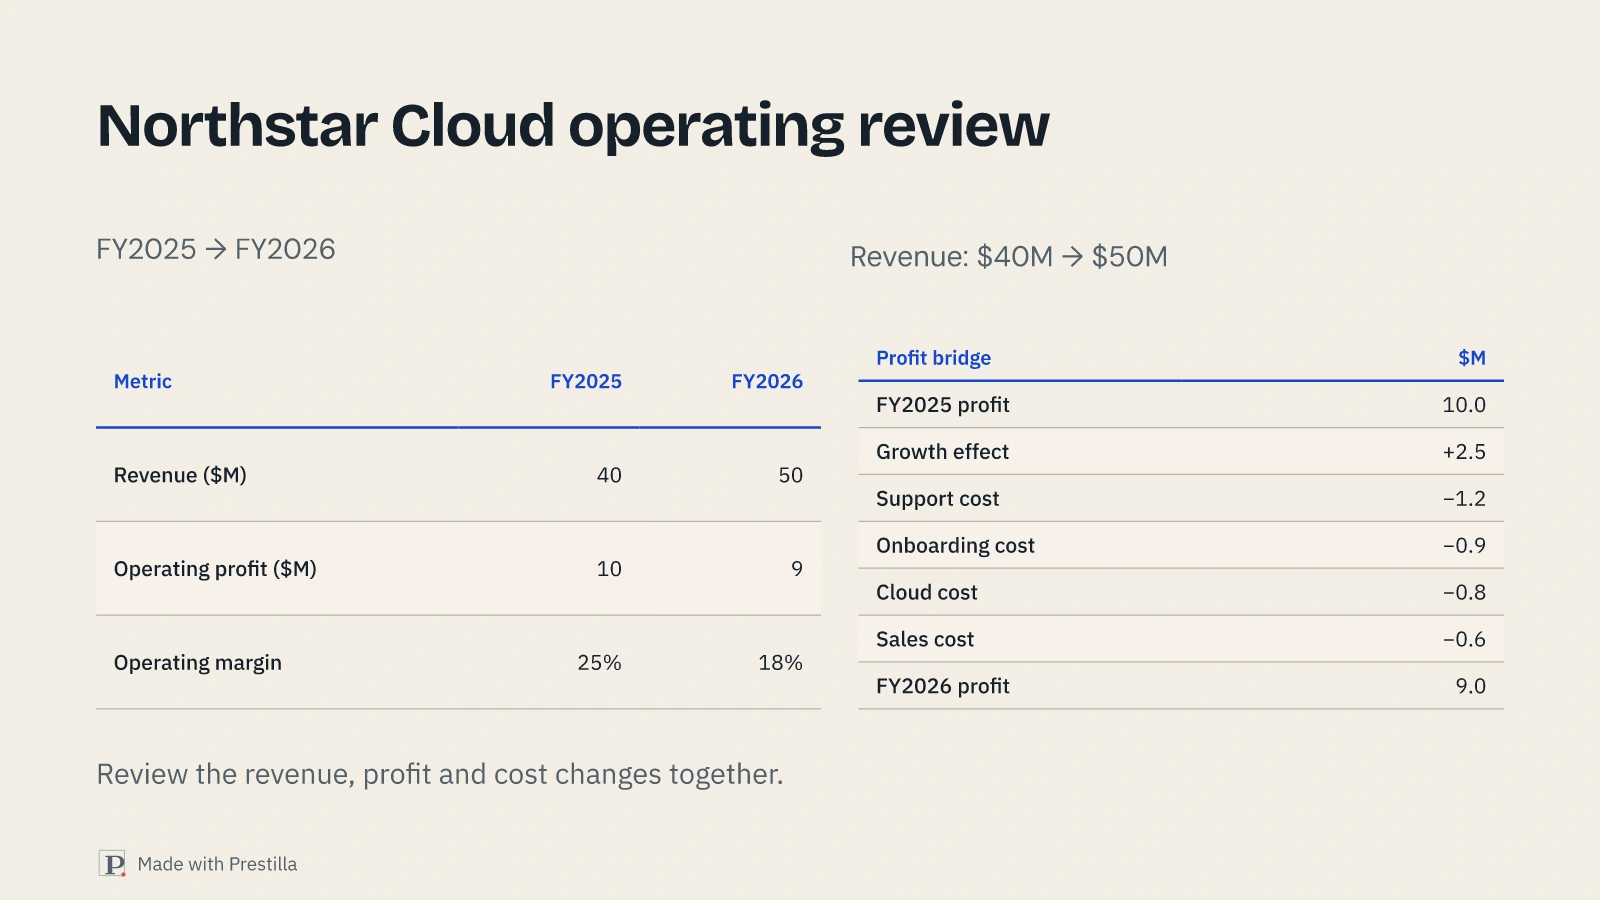
Operating review tables with the revenue, profit, margin and cost bridge. Actual native Prestilla render; illustrative data.
After Changes marked in orange
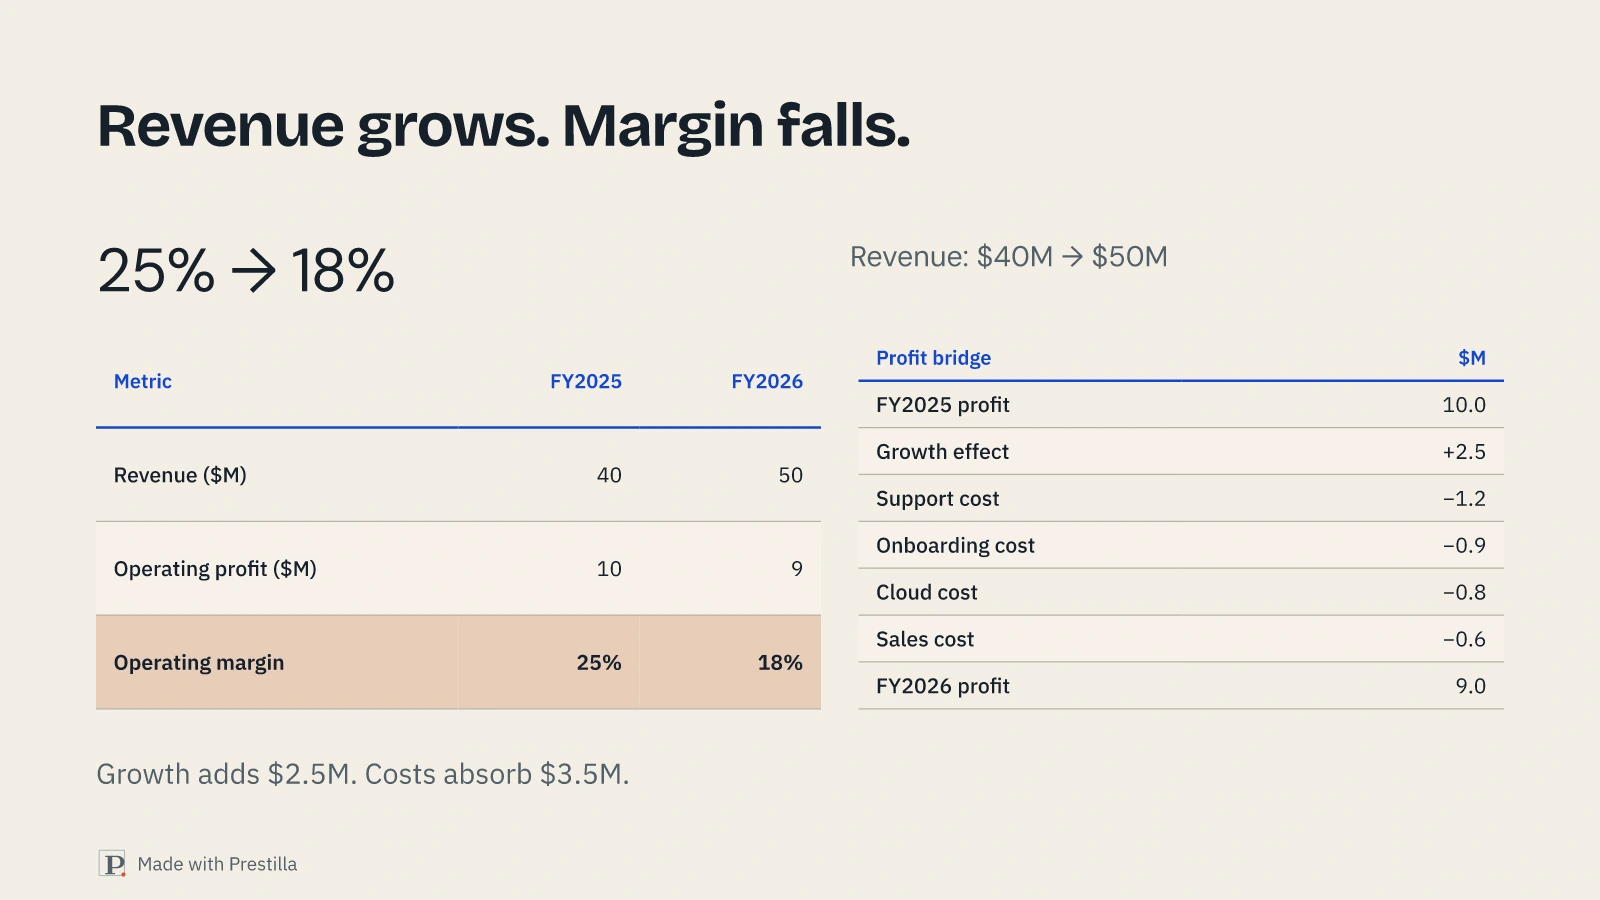
Revised headline, prominent margin decline and highlighted table row. Actual native Prestilla render; illustrative data.
  1. Sharper headline
  2. Margin decline up front
  3. Key row highlighted

Bring the decision into focus. Keep the supporting numbers.

Create a deck I can shape

100 free credits · No credit card required

06Change the visual

The same facts. A stronger visual form.

Explore a different way to tell the story. Turn a table into a profit bridge, or compare chart and diagram alternatives.

Profit bridge

“Turn the tables into a profit bridge and show the next steps.”

Before
The same financial story shown with two tables. Actual native Prestilla render; illustrative data.
After Changes marked in orange
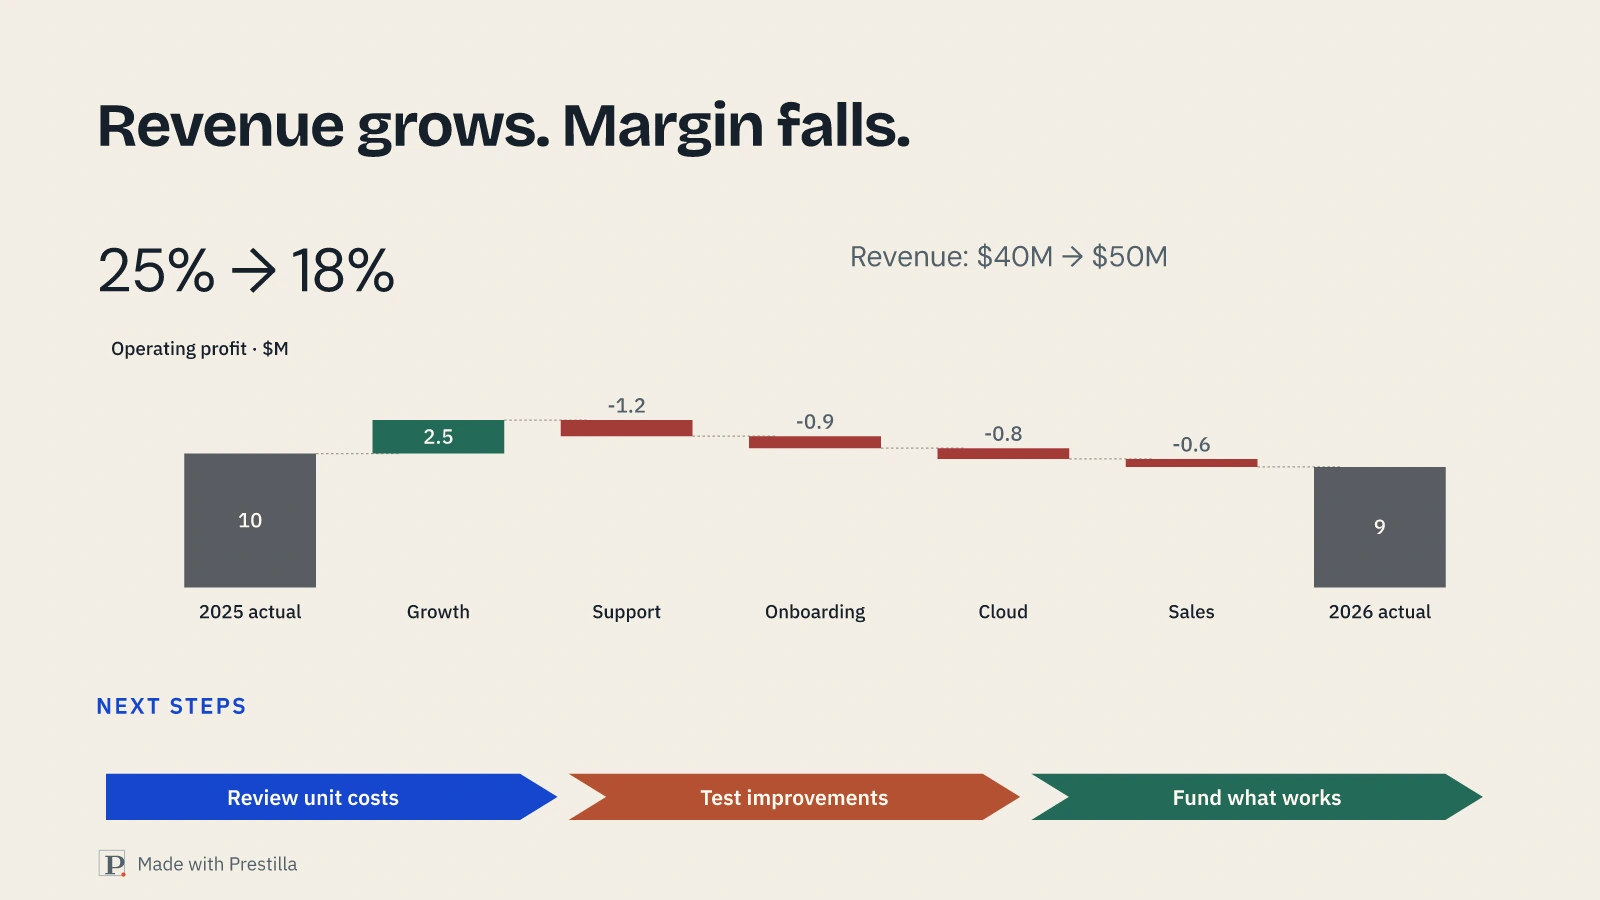
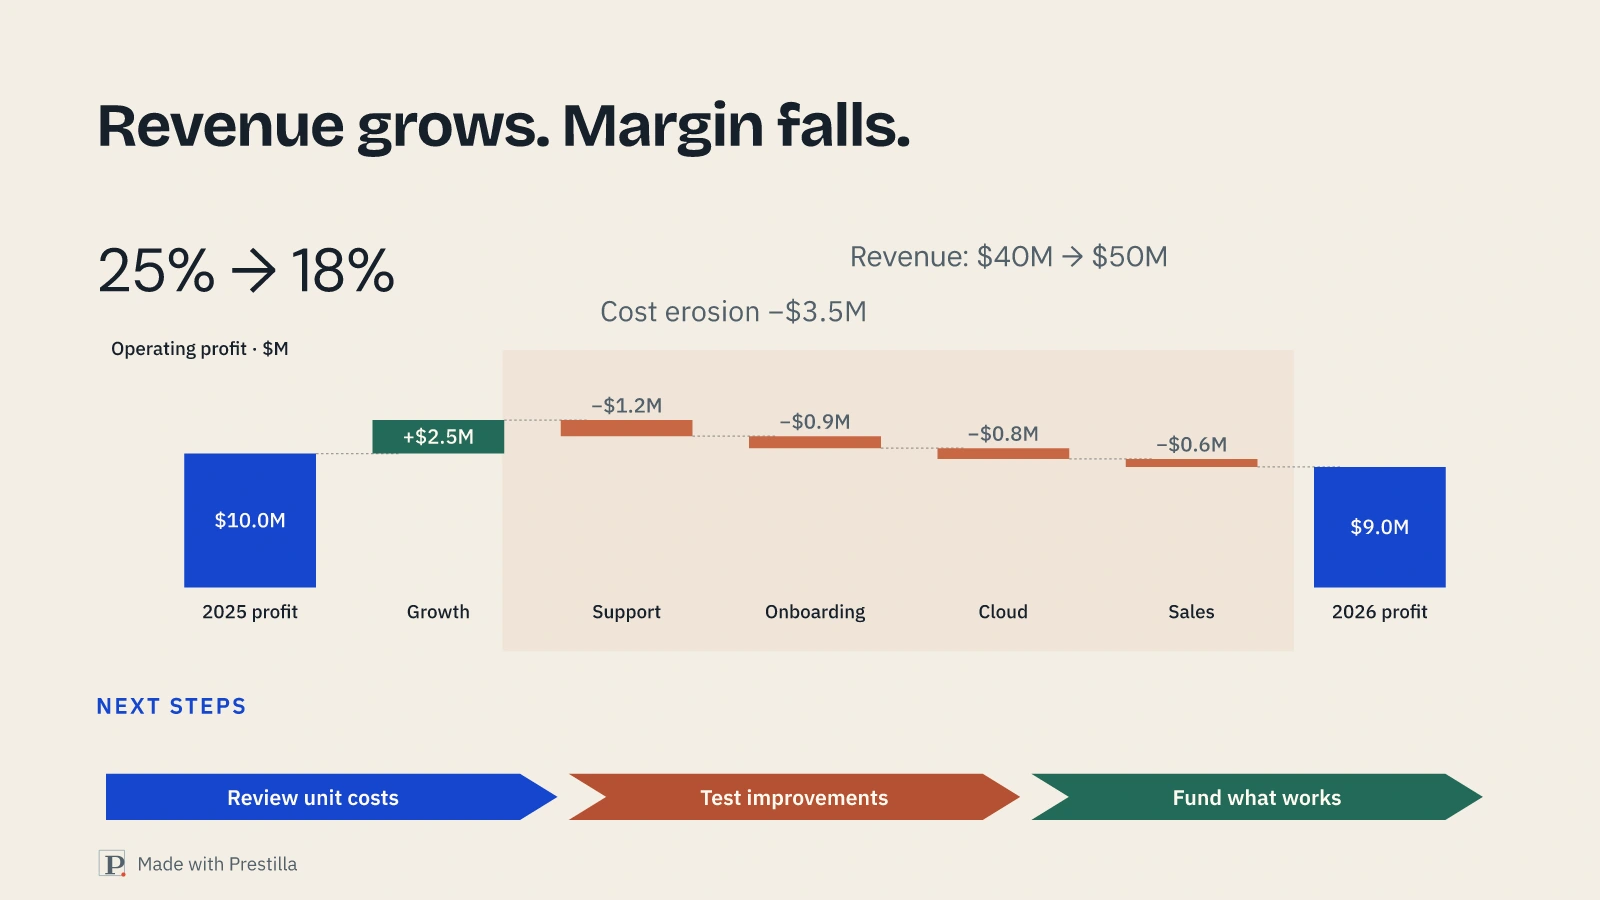
The same figures shown as a waterfall chart alongside an action flow. Actual native Prestilla render; illustrative data.
  1. Table becomes a profit bridge
  2. Next steps become a flow

A new visual form, with the same financial facts.

Chart + two diagrams

“Turn the decision table into an opportunity chart, a pilot plan and a funding decision.”

Before
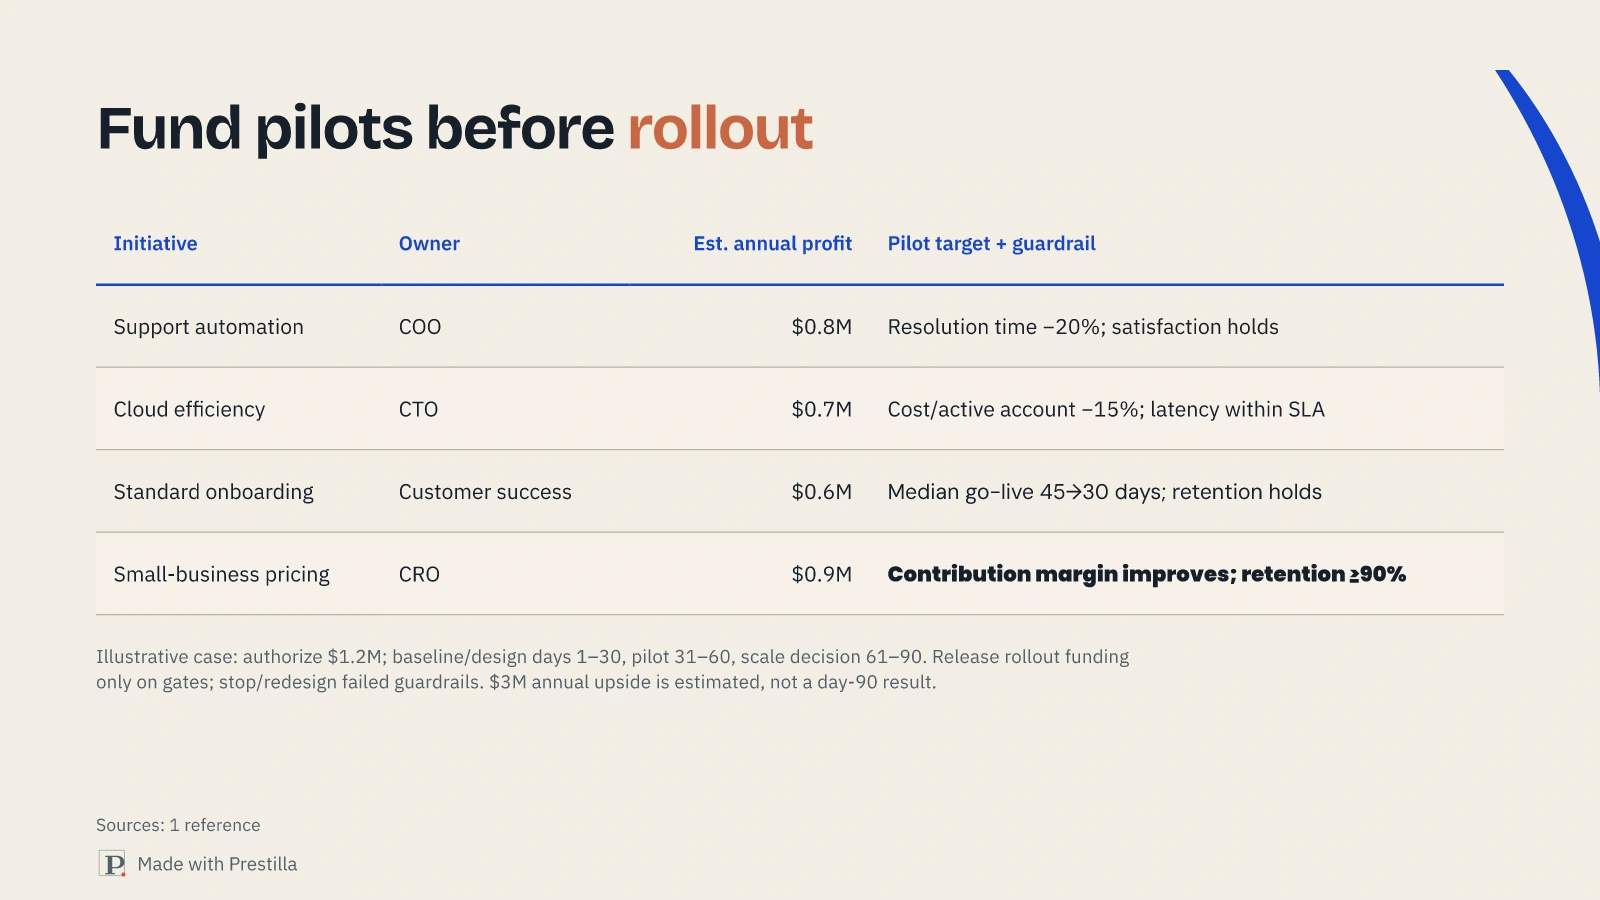
The original Northstar Cloud decision table with initiative estimates, owners and pilot gates. Actual Prestilla render; fictional illustrative data.
After Changes marked in orange
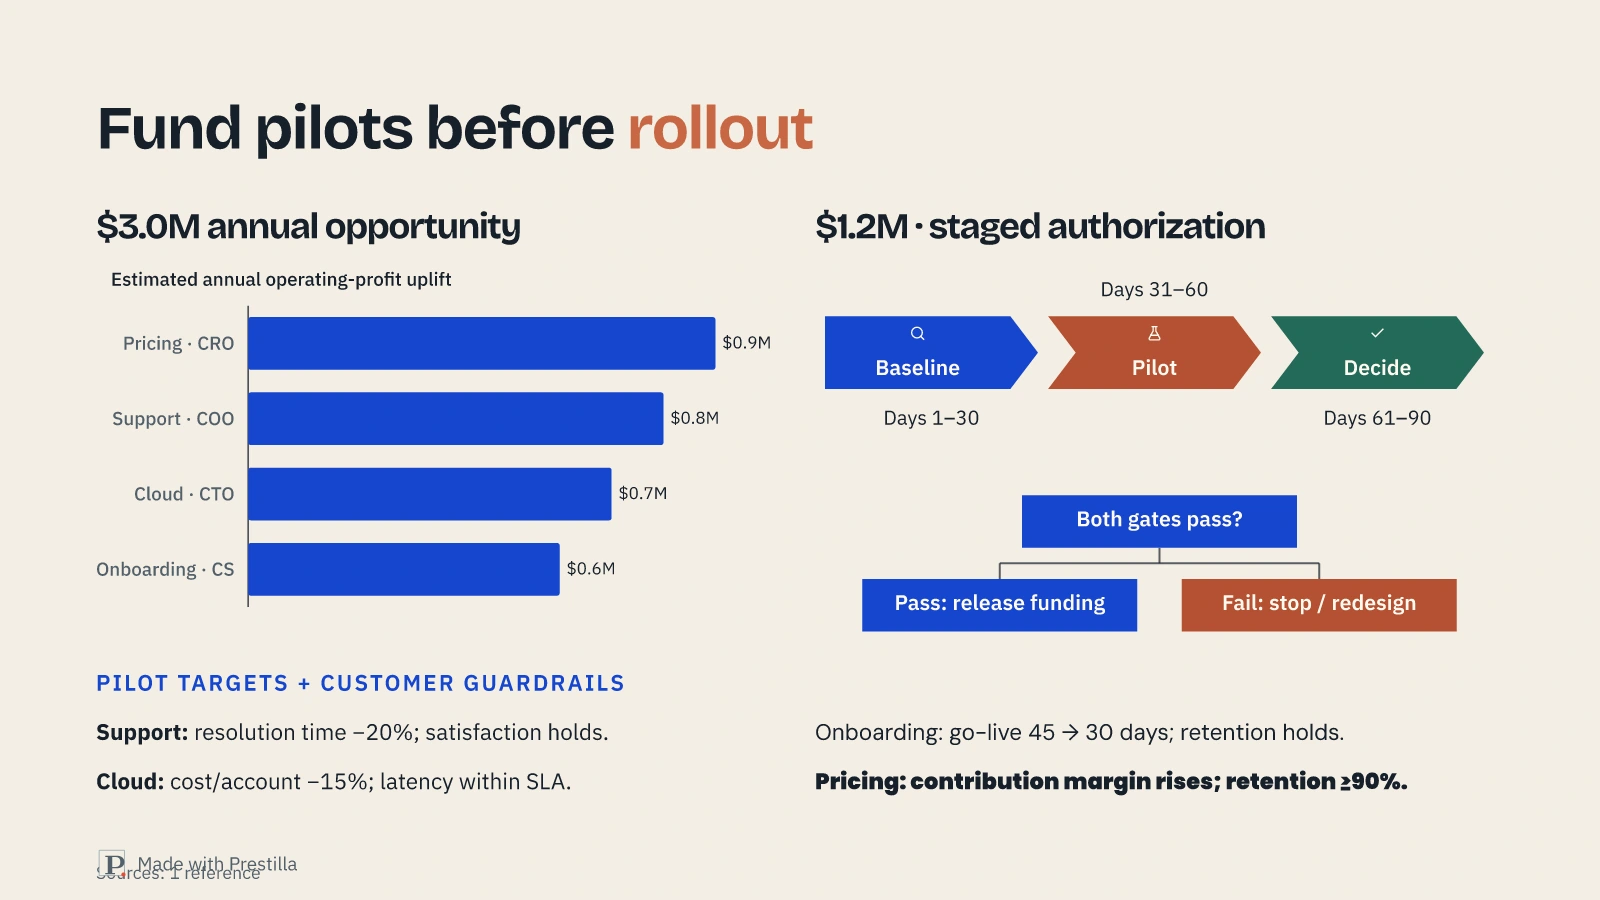
The same initiative plan shown as a ranked opportunity chart, 90-day process and conditional funding diagram. Actual Prestilla render; fictional illustrative data.
  1. Ranked annual opportunity
  2. 90-day pilot plan
  3. Conditional funding gates

Same estimates, owners and guardrails. Three visuals, one decision. Annual upside is estimated; the pilot ends in a scale decision.

Build my visual story

100 free credits · No credit card required

07Make final adjustments

Refine the details. Make it yours.

Polish an exhibit, explore different compositions, and keep shaping the presentation after the first draft.

Polish the details

Add precise $M labels, emphasise cost erosion, and clarify the year labels.

Before
Profit bridge with basic number and year labels. Actual native Prestilla render; illustrative data.
After Changes marked in orange
Profit bridge with currency labels, cobalt totals and shaded cost erosion. Actual native Prestilla render; illustrative data.
  1. Cost erosion emphasised
  2. Precise currency labels
  3. Clearer year labels

Fine-tune the labels, colours and emphasis.

Explore alternatives

“Show me two ways to present this table—with cards or diagrams.”

Before
Original Northstar Cloud table of four initiatives, owners, estimated annual profit and pilot guardrails. Actual Prestilla render; illustrative data.
1Cards + chart
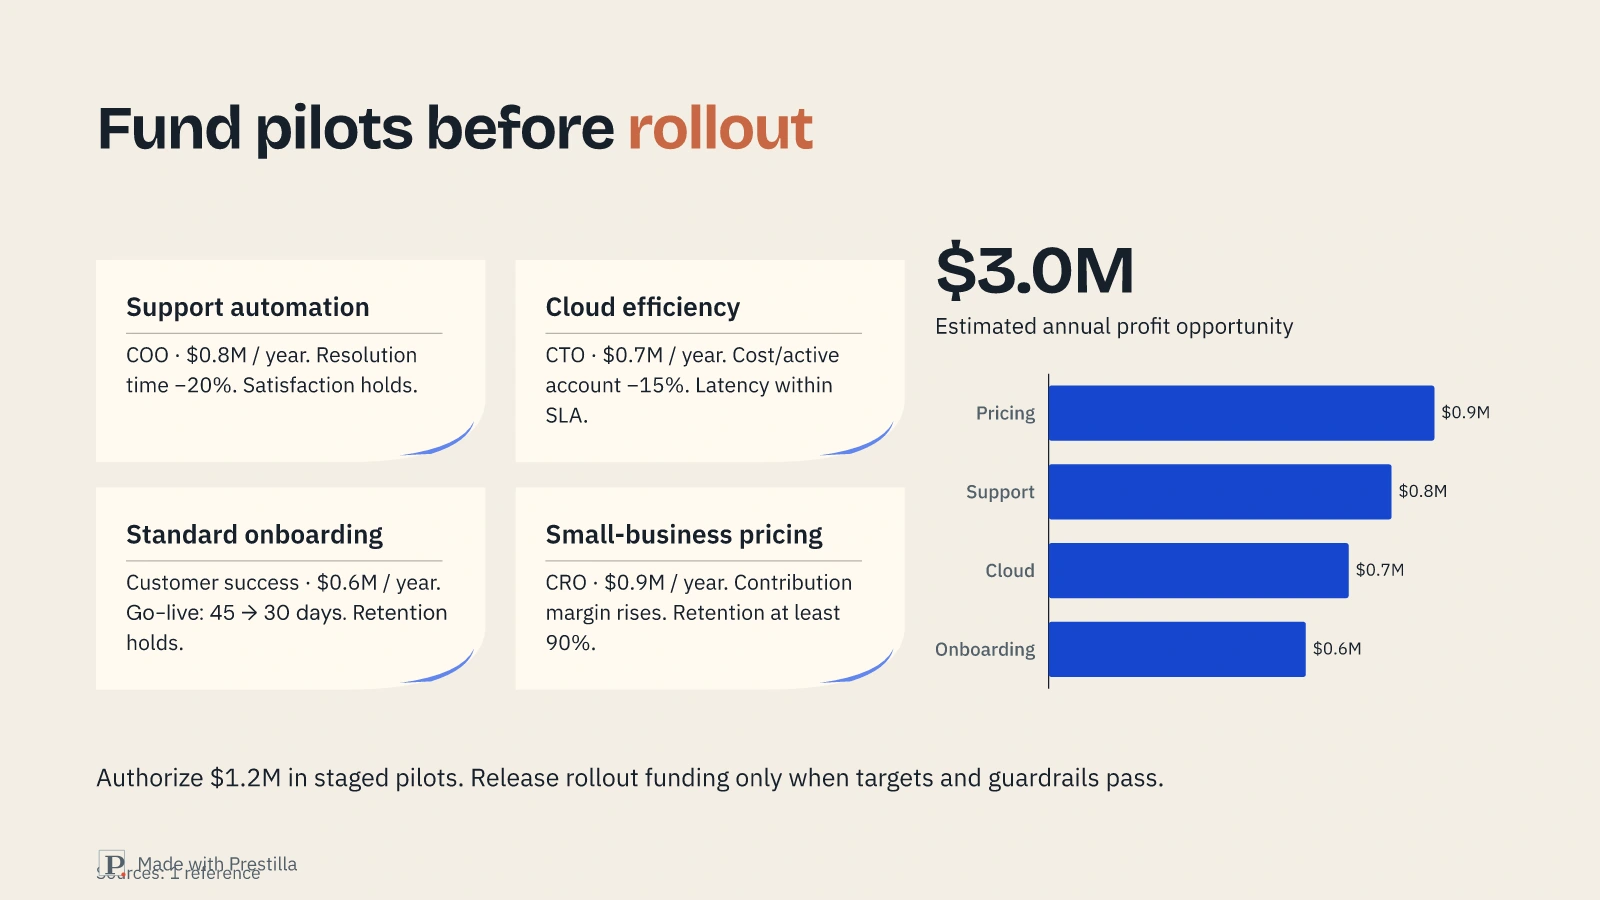
The same four initiatives as native cards with a ranked opportunity chart. Actual Prestilla render; illustrative data.
2Chart + diagrams
The same initiative table as an opportunity chart, pilot timeline and conditional funding diagram. Actual Prestilla render; illustrative data.
  1. Cards + ranked chart
  2. Opportunity + pilot diagrams

One table. Two ways to tell the story. Same owners, estimates and guardrails.

Start creating for free

100 free credits · No credit card required

08Deep research

Find the evidence your work needs.

Research across disciplines, from public datasets and company filings to published research and X. Develop the evidence into a substantive argument.

200+ sources for deep researchResearch across finance and economics, health and medicine, science and technology, climate and energy, industry and trade, people and society, government and law, places and infrastructure. Coverage includes native providers, X / Twitter and broader web research. DEEP RESEARCH200+Sourcesfor deep researchFind the evidenceyour work needs.RESEARCH ACROSS DOMAINS01Finance &economicsMarkets, companies & economies02Health &medicineTrials, care & public health03Science &technologyResearch, software & innovation04Climate &energyEarth systems & energy05Industry &tradeCommerce & supply chains06People &societyPopulation, education & development07Government &lawPolicy, regulation & public records08Places &infrastructureHousing, transport & geospatial dataPublic datasets · Company filings · Published research · Official records · X / Twitter · Web research

Business & economics

SEC EDGAR, FRED, World Bank, IMF, OECD, and company filings.

Science & healthcare

PubMed, ClinicalTrials.gov, openFDA, Crossref, and OpenAlex.

Energy & the environment

EIA, EPA, NOAA, NASA Earthdata, and NREL.

Public data & policy

Data.gov, U.S. Census Bureau, Congress.gov, and Federal Register.

Technology & current discussion

GitHub, Hugging Face, and X.

Source availability and access vary by topic.

Create a researched presentation

100 free credits · No credit card required

09Bring your own data

Your own material. A clearer visual story.

Bring your source documents, data, and notes. Turn them into charts, cards, and diagrams while preserving the facts that matter.

Profit bridge

Document excerptIllustrative data

Northstar Cloud — operating review

Finance input$M
2025 profit10.0
Growth effect+2.5
Support cost−1.2
Onboarding cost−0.9
Cloud cost−0.8
Sales cost−0.6
2026 profit9.0
Support upside+0.8
Cloud upside+0.7
Onboarding upside+0.6
Pricing upside+0.9

Recovery estimates exclude $1.2M one-time spend.
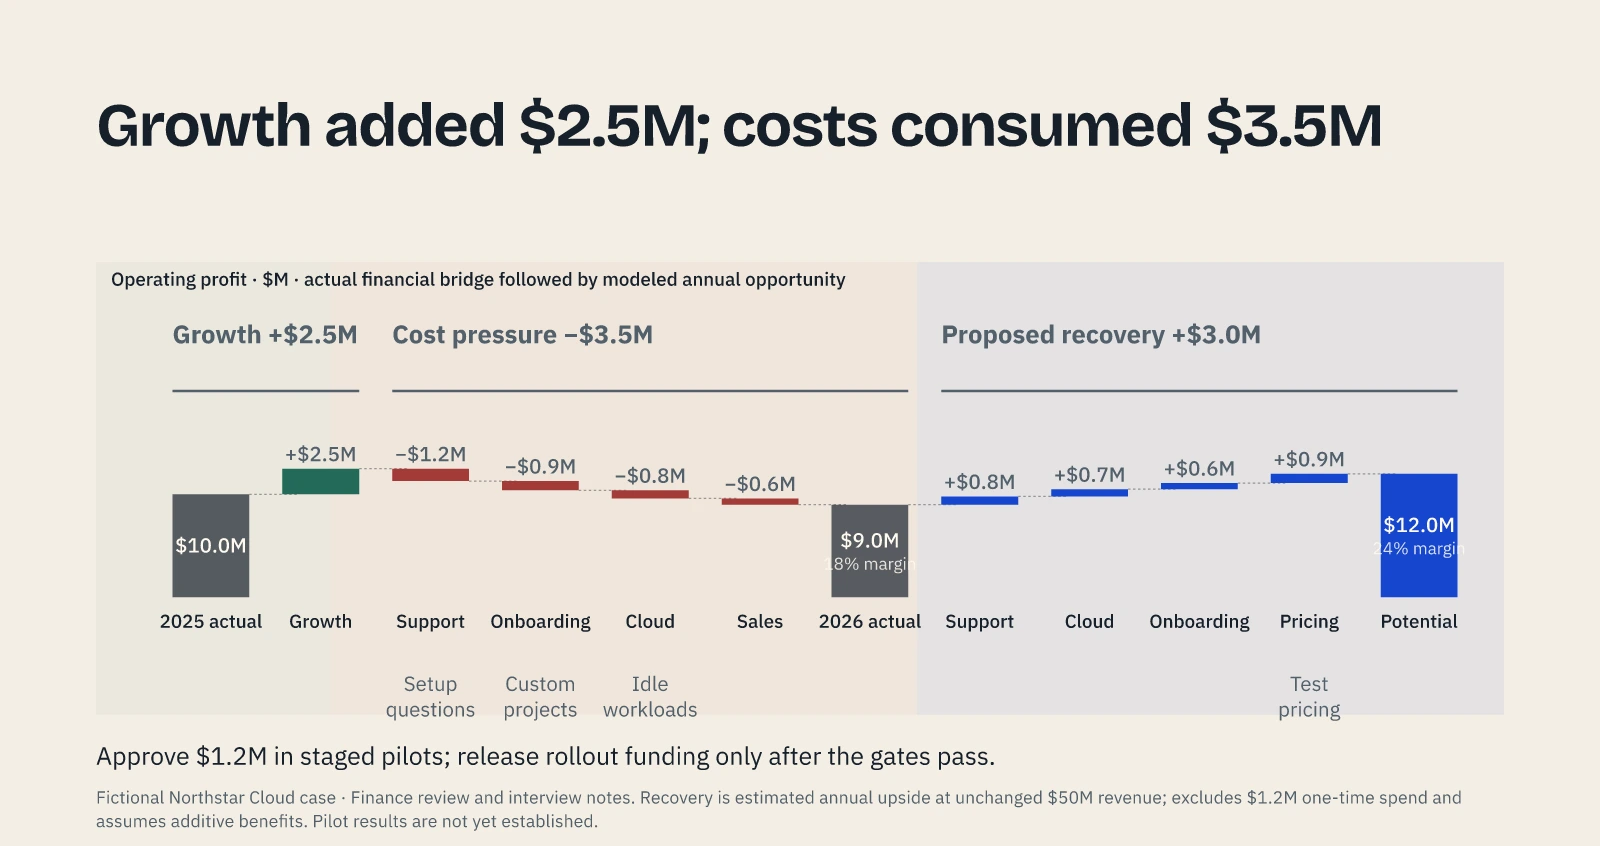
Operating-profit waterfall showing growth, cost erosion, and modeled recovery. Actual Prestilla output; fictional illustrative data.

Split analysis

Spreadsheet excerptIllustrative data

finance.csv

Segment2025 profit2026 profit
Enterprise5.45.72
Mid-market32.8
Small business1.60.48

Profit in $M. Revenue: $40M → $50M; margin: 25% → 18%.
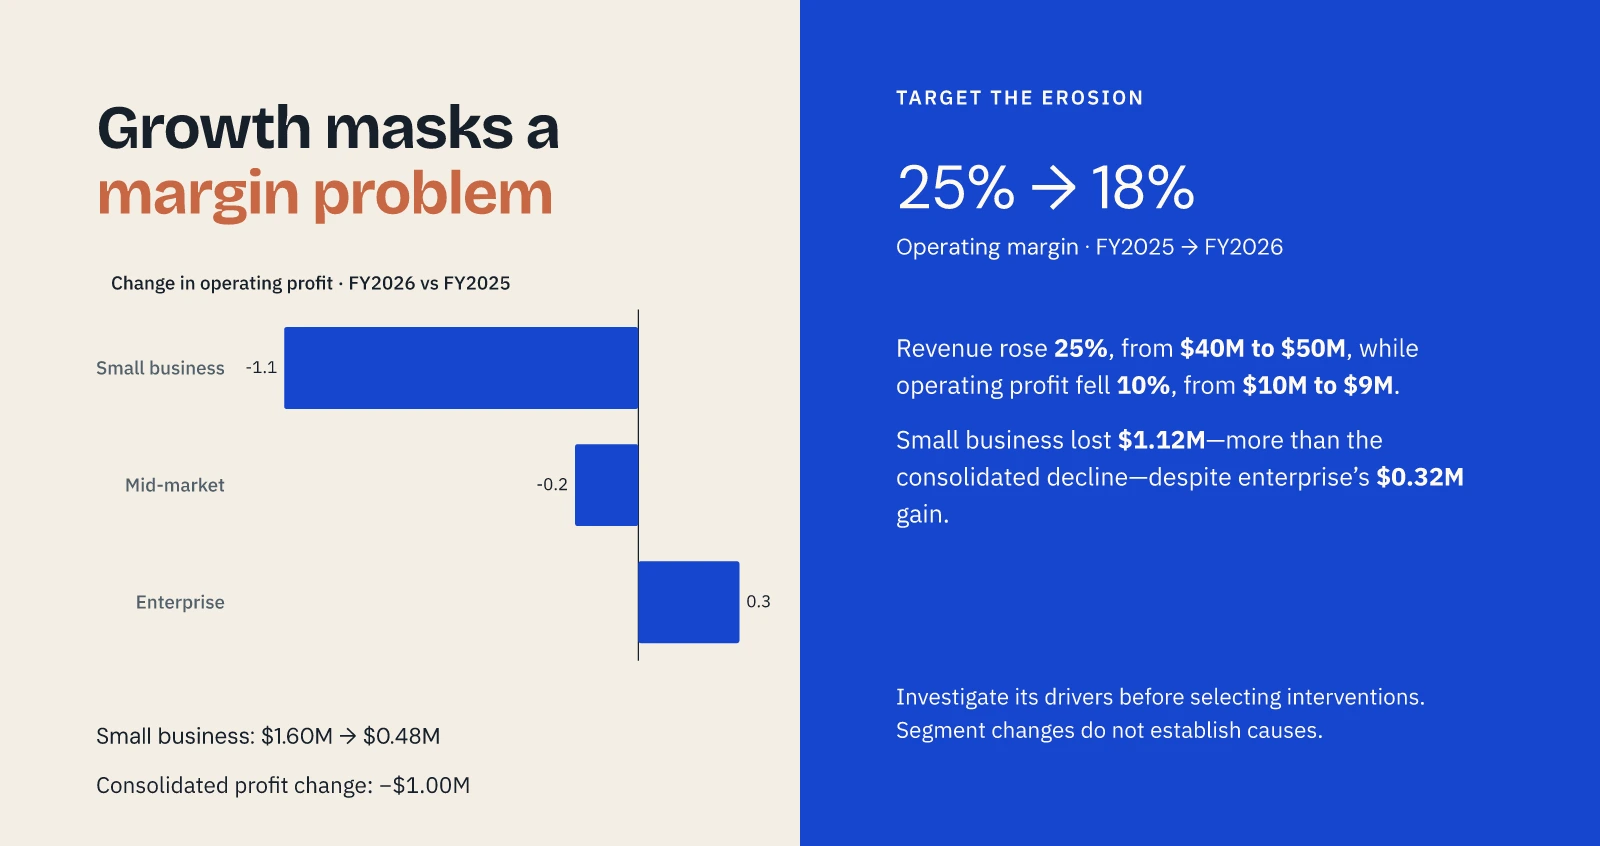
Profit changes and margin interpretation on porcelain and cobalt fields. Actual Prestilla output; fictional illustrative data.

Pilot decisions

Initiative plan excerptIllustrative data

initiatives.csv

Initiative / owner$M/year
Support automation · COO0.8
Cloud efficiency · CTO0.7
Standard onboarding · Customer success0.6
Small-business pricing · CRO0.9

Budget $1.2M. Baseline: days 1–30; pilot: 31–60; scale decision: 61–90. Rollout requires target and guardrail to pass.
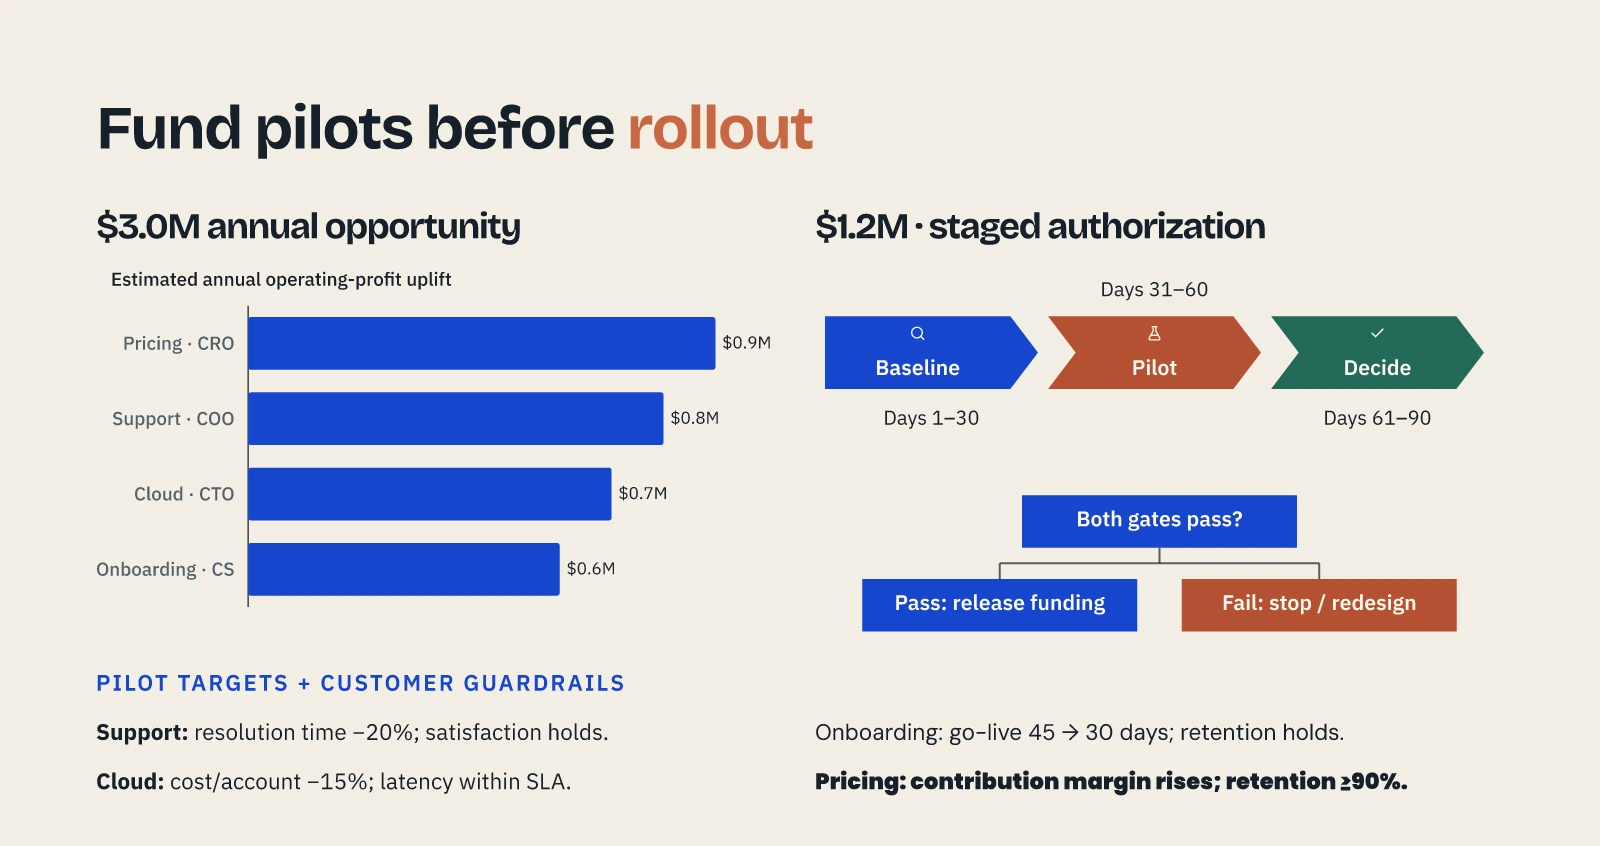
Annual opportunity chart, 90-day process and conditional funding diagram. Actual Prestilla output; fictional illustrative data.

Growth channels

Illustrative data reportIllustrative data

Startup acquisition — Q3 cohort

ChannelCustomersCAC ($)
Customer referrals60180
Content & search110260
Channel partners45420
Paid search140680

CAC = channel spend ÷ new paying customers; excludes shared overhead.
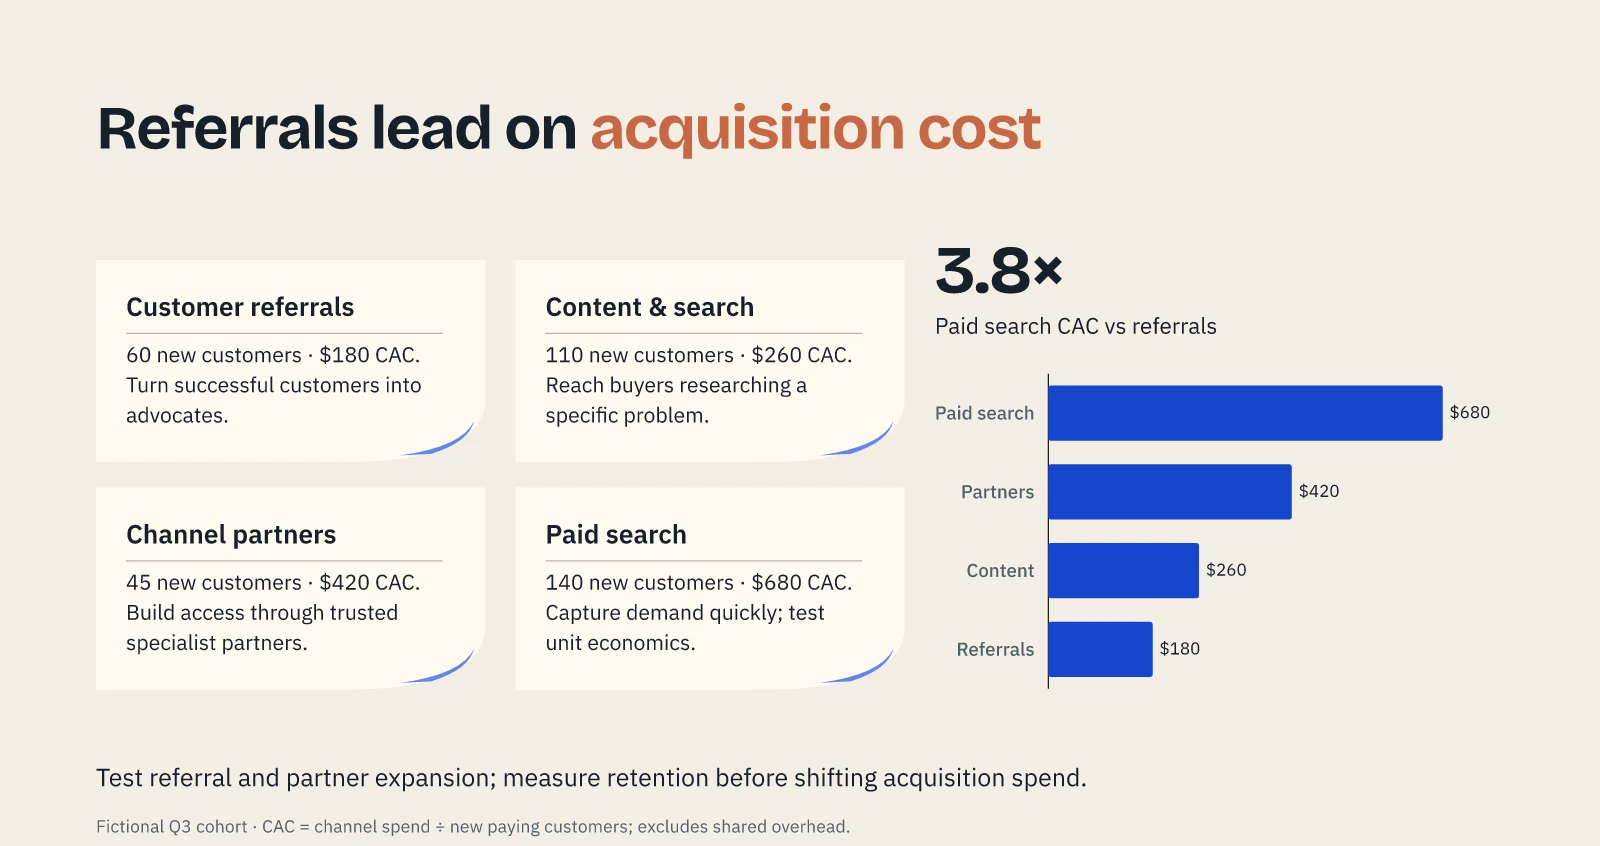
Four startup acquisition-channel cards with customer volumes and cost comparison. Actual Prestilla output; fictional illustrative data.
Create with my material

100 free credits · No credit card required

For work that matters

Give your thinking
its fullest expression.

Start with 100 free credits. No credit card required.
Pay as you go. No subscription.

Create my first presentation

For founders, business owners, consultants, sales and marketing teams, strategy and finance teams, researchers, and educators.